
There are always two sides of every story. There is always the good and the bad, the advantages and the disadvantages. When studying a certain topic or analyzing a certain situation, it is sometimes hard to come up with a conclusion especially when the subject contains a lot of contributing factors all at once. Oftentimes, using charts can help in determining the proper classification or category of a certain matter in the subject.
Contents
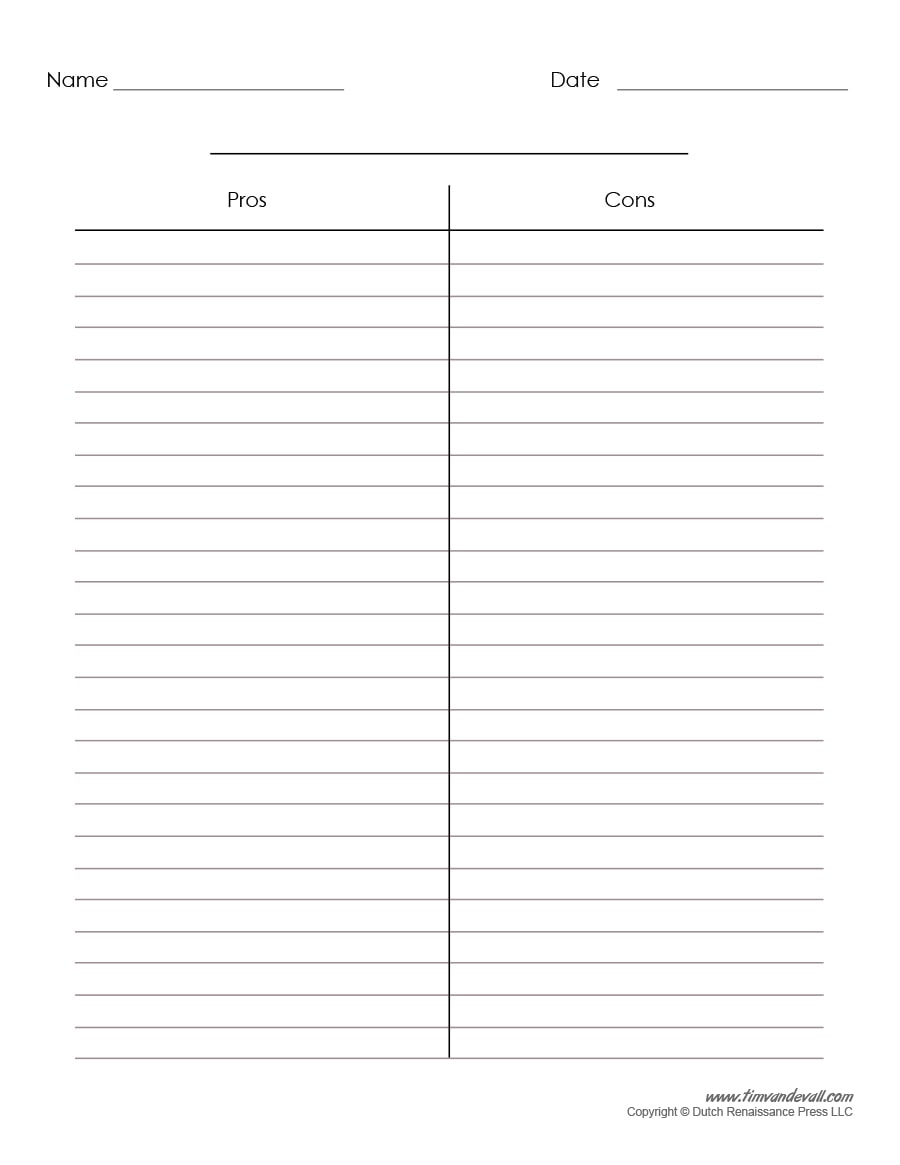
If you are trying to analyze a subject and differentiate its pros and cons, or make comparisons on certain subjects, using a T chart is a helpful tool. Basically, the T chart is all about making a list of comparisons on a subject. By seeing both the negative and the positive angles of certain, it will become easier to derive with a conclusion.
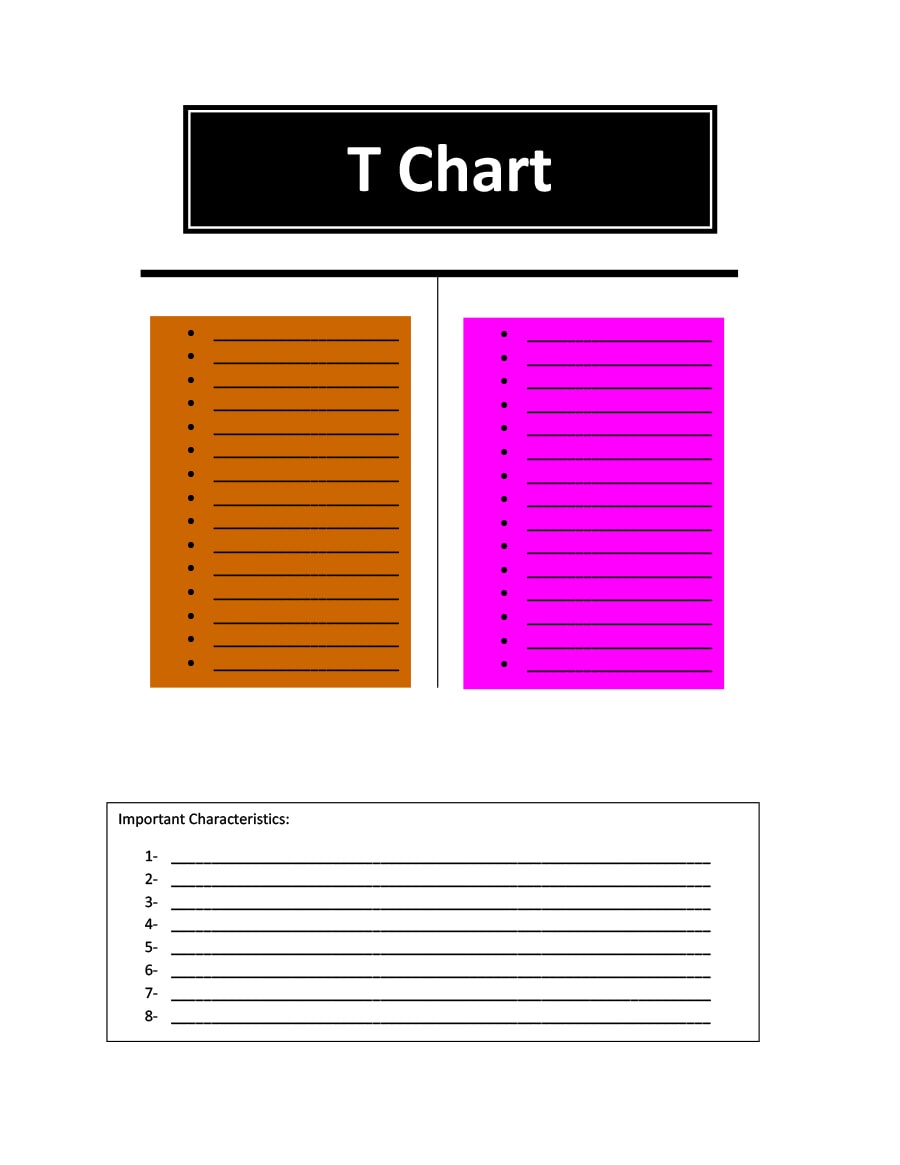
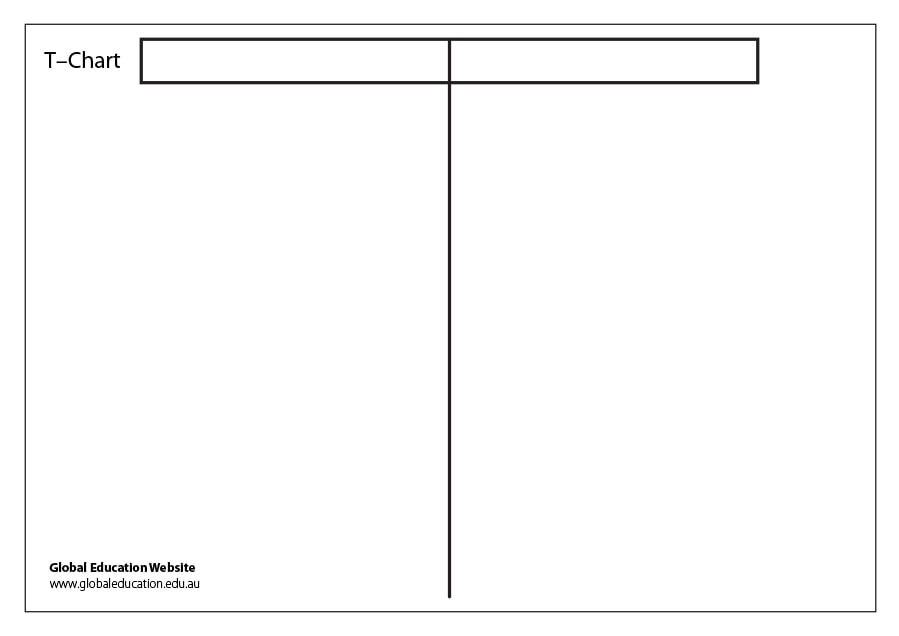
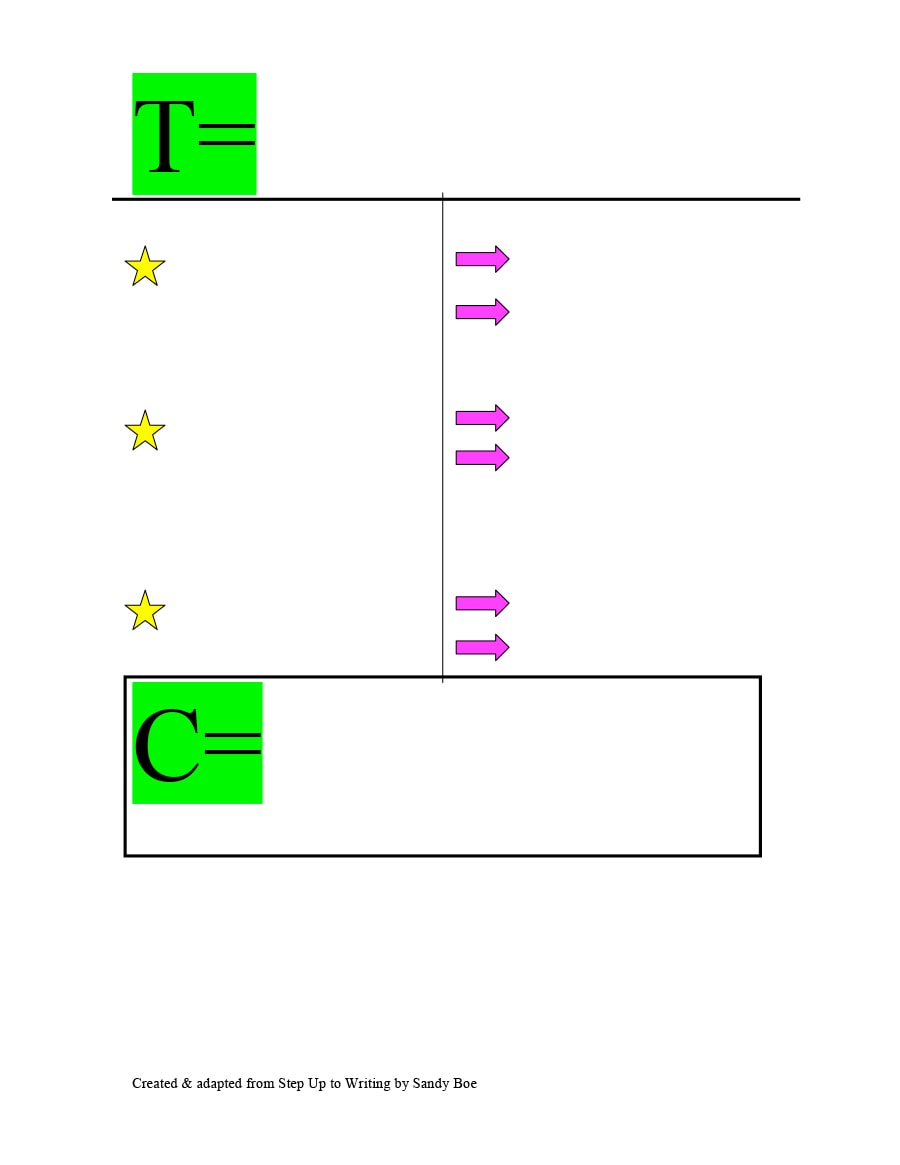
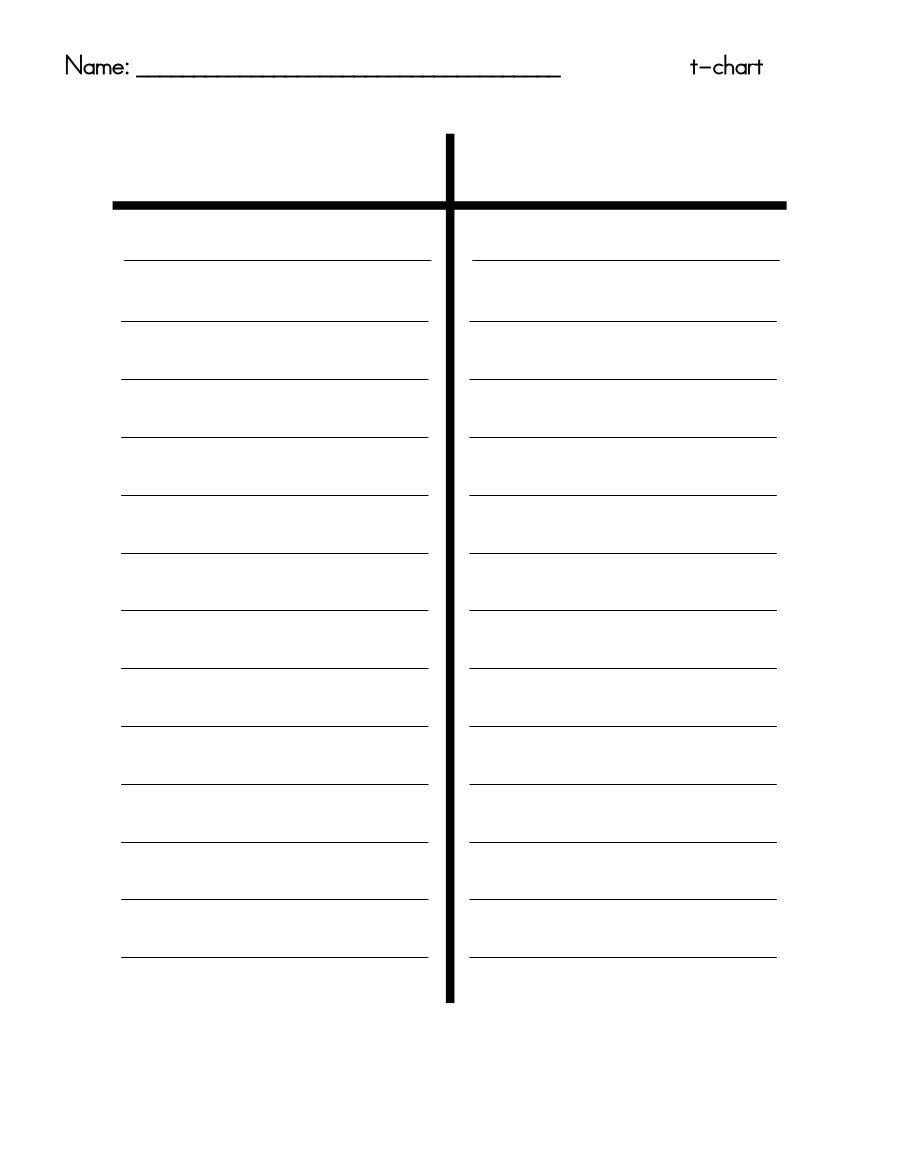
There is no specific information on why the chart is named as such, but mostly it took after the formation of the letter “T”, in which the upper line of the letter is where the topic is placed, while the vertical stem separates the comparisons made for the topic. T charts have been used in both fields of science and liberal arts. Whether you need to derive numbers or list down contrasting properties, using t charts are helpful tools in completing your study.
Making your own T chart can simply be done manually by drawing a line in between your findings if you are still just writing on a scratch, or inserting a table into a word processing program on a computer. But for teachers who want to make learning fun for their students or professionals who want to create a presentable report, or a student who simply wishes to add a little décor on their study printouts or create a presentation, you can access a T chart on this page.
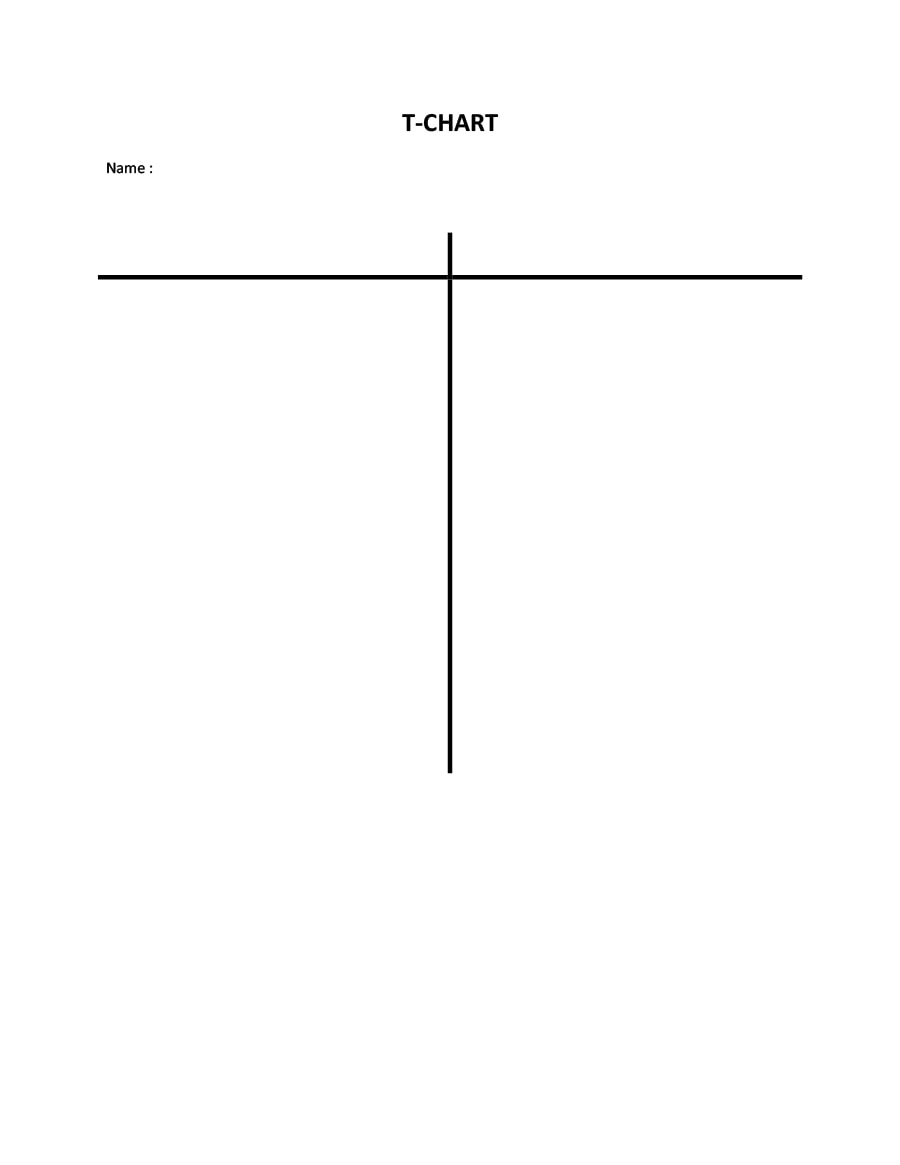
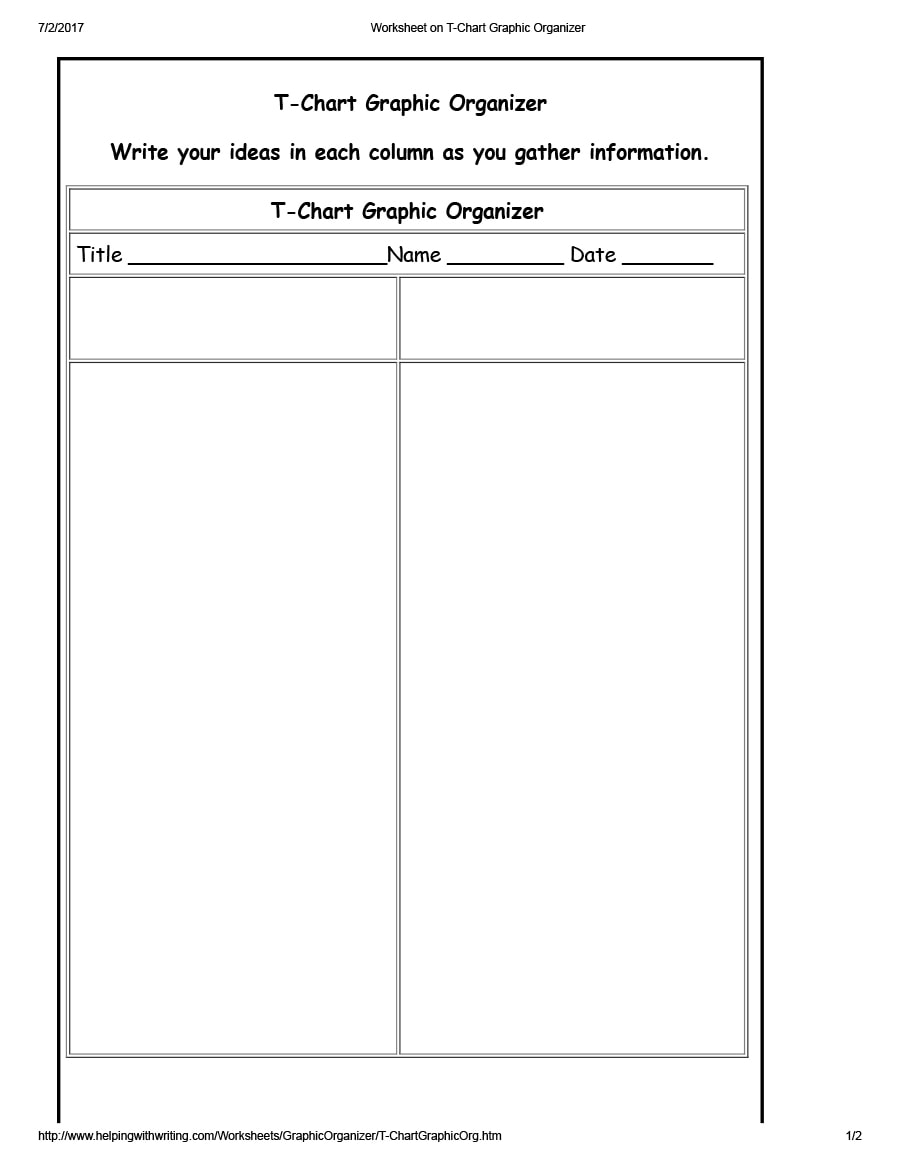
T-Chart Templates
Main reasons for using a T chart
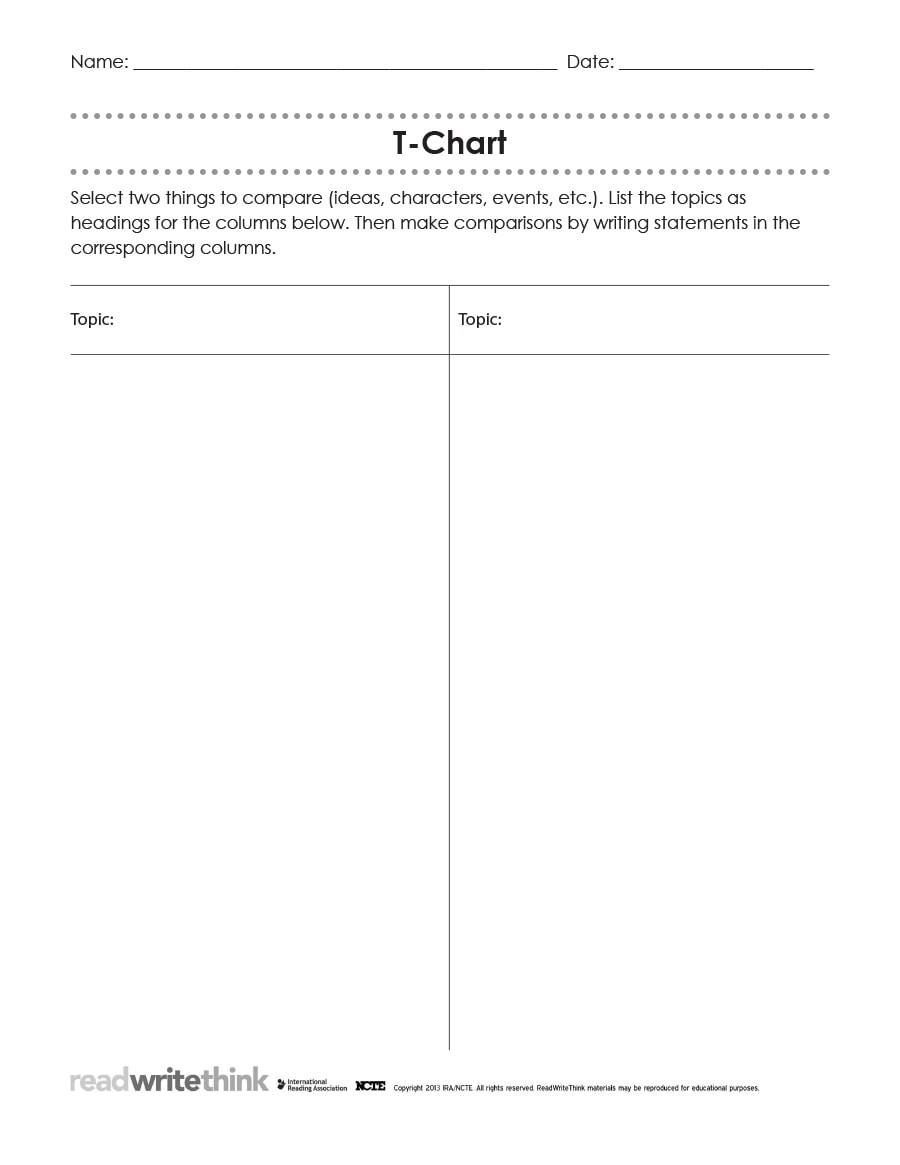
To compare and contrast
In some fields of study, comparisons must be made to come up with a result. This is usually in science experiments where they will compare a certain specimen under different circumstances. For example, a chemist wants to find out how much-carbonated drink is needed to fully dissolve a tooth. In this experiment, they might need to use a T chart example to list down the different volumes used in each experiment, and the result on the other side of the chart.
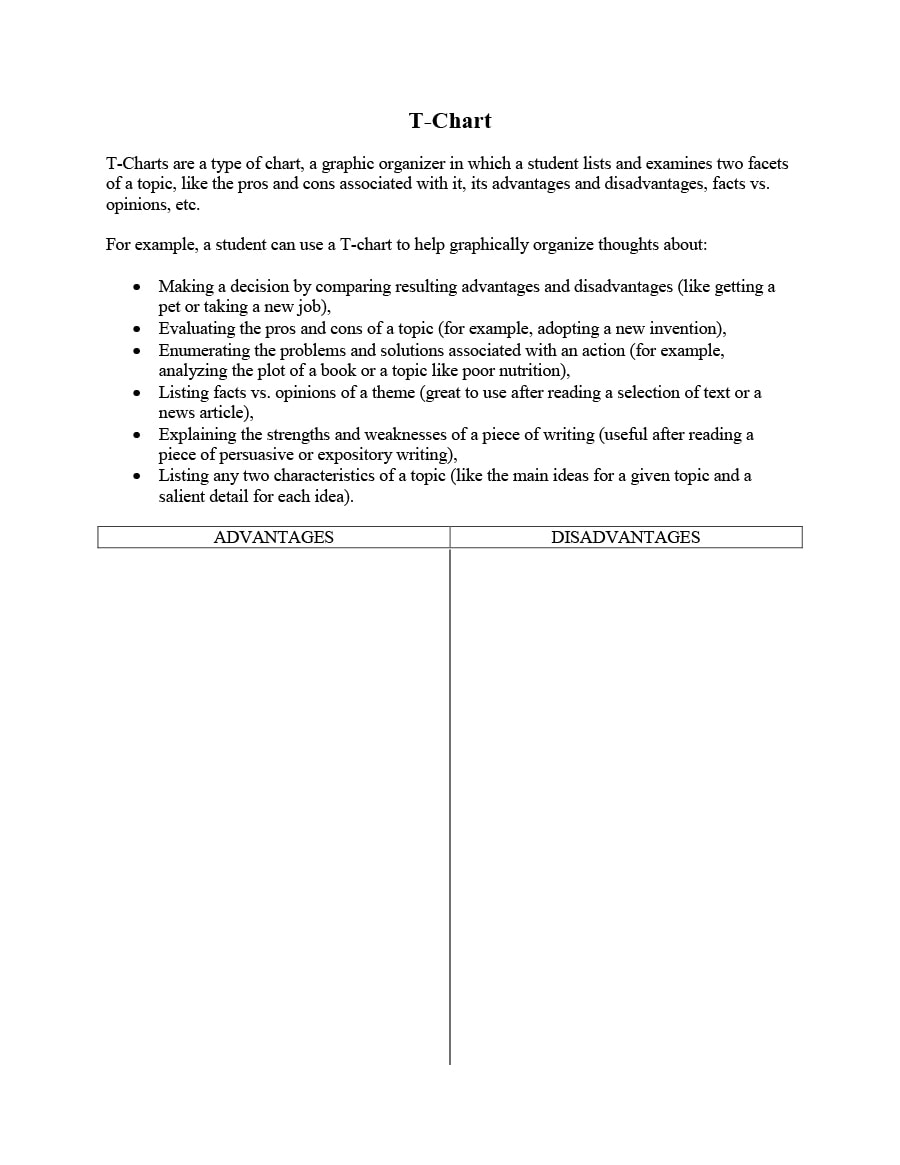
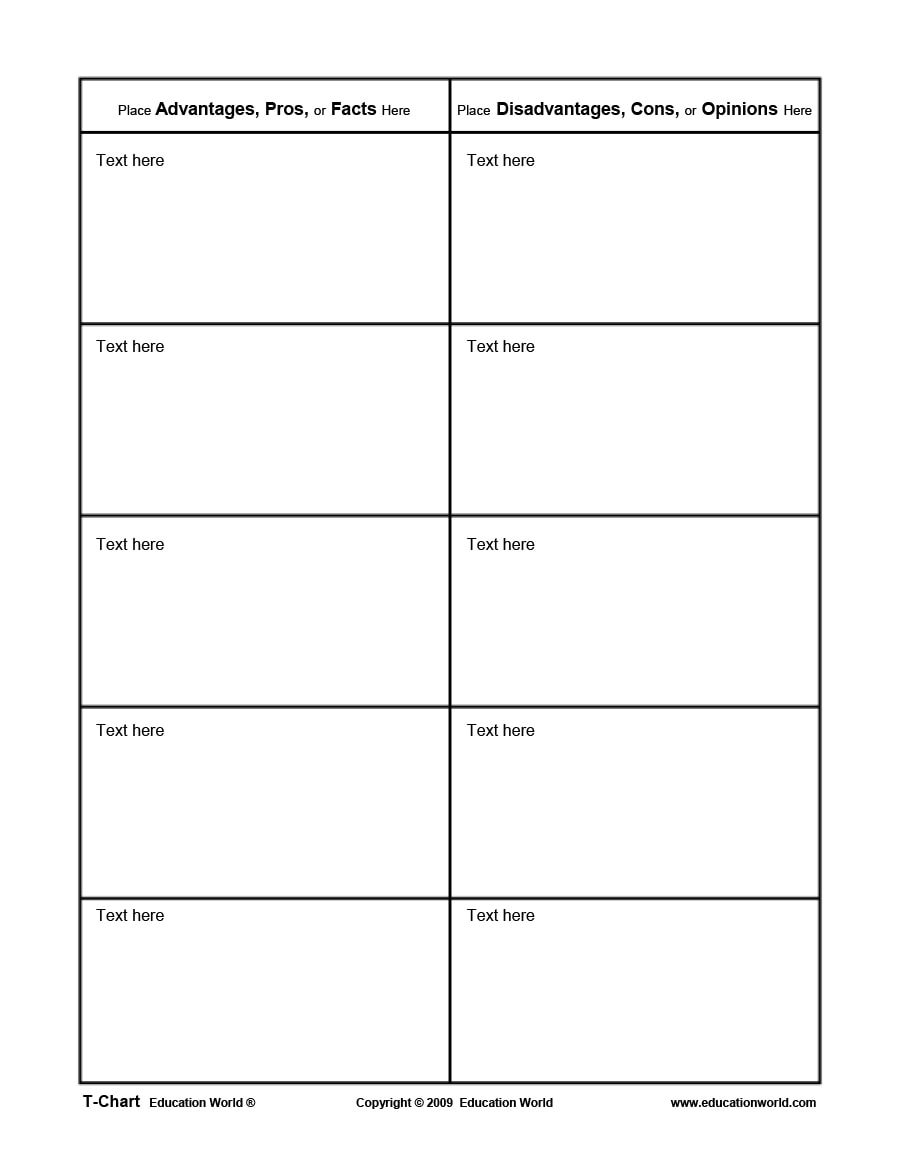
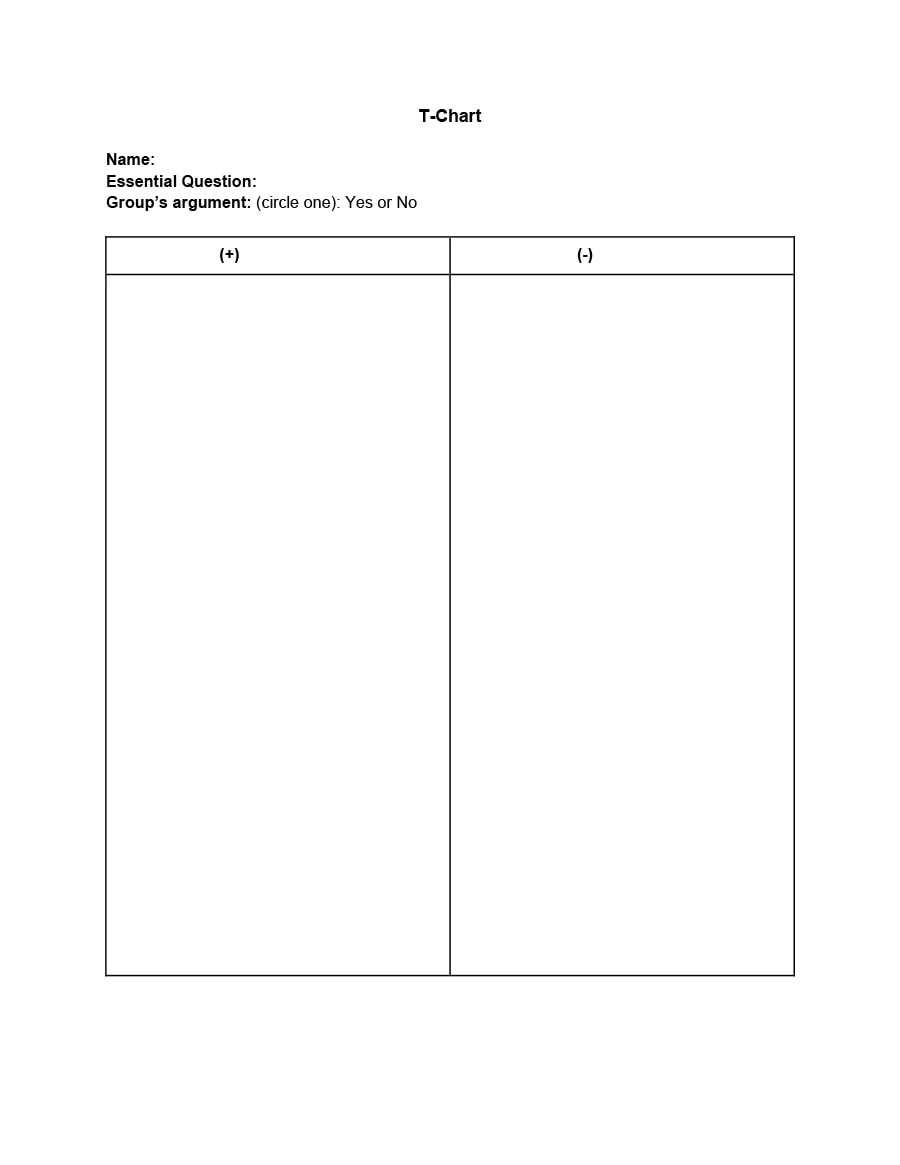
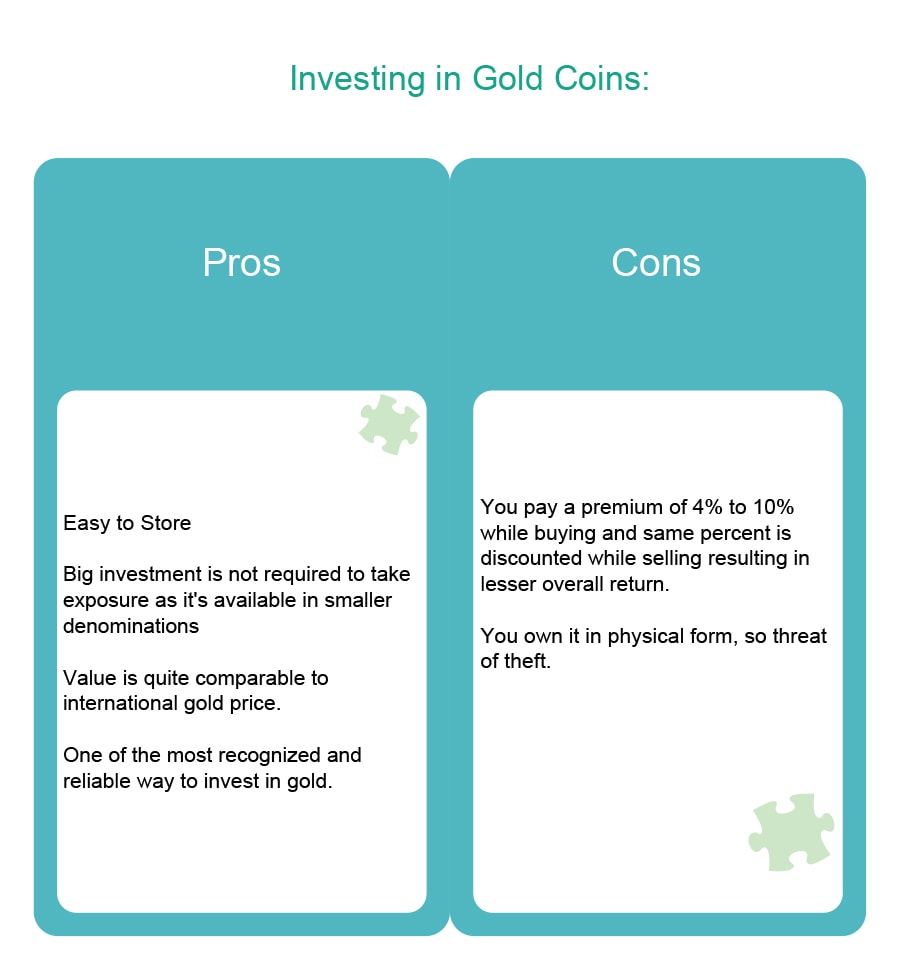
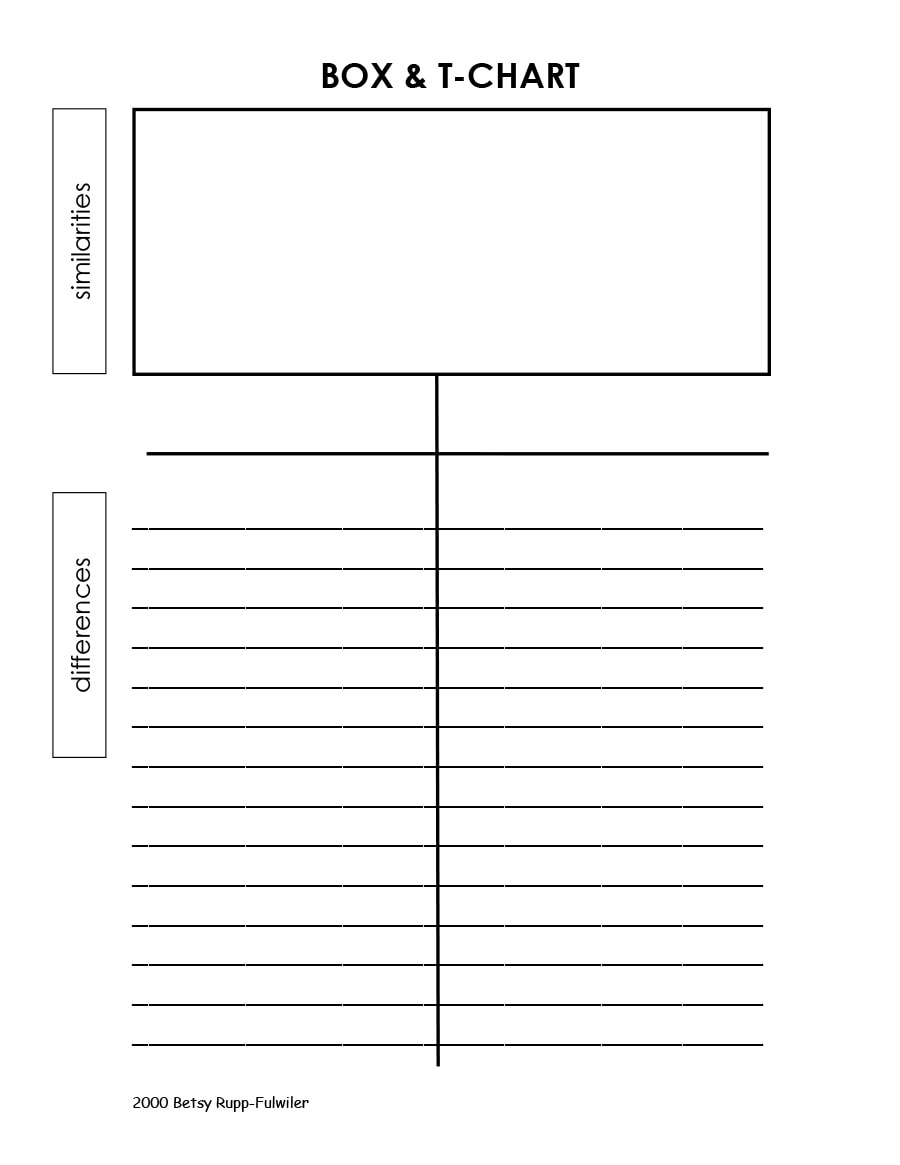
Compare and contrast come in other forms such as listing the pros and cons of a certain action, the advantage or disadvantages of a certain topic, or the strengths and weaknesses of a certain entity. Showing opposites is the common use of T charts. For a more detailed report or better visuals, you can make use of a T chart graphic organizer to fully demonstrate the differences of your experiments.
To distinguish details
Apart from showing the differences of certain subjects, T charts can also be used to organize data. Such is distinguishing a fact from an opinion, or simply stating the characteristics of two different entities. This is simply just to organize and summarize gathered data.
To classify
Information is often scattered during the data gathering process. Once you’re done with data gathering, you review the information you have gathered and classified them according to their categories. A T chart comes in useful during this process. It could be the problem on one side and the corresponding data you have gathered on the other side or the problem on the left and the solution to the right. T charts are very useful in classifying information.
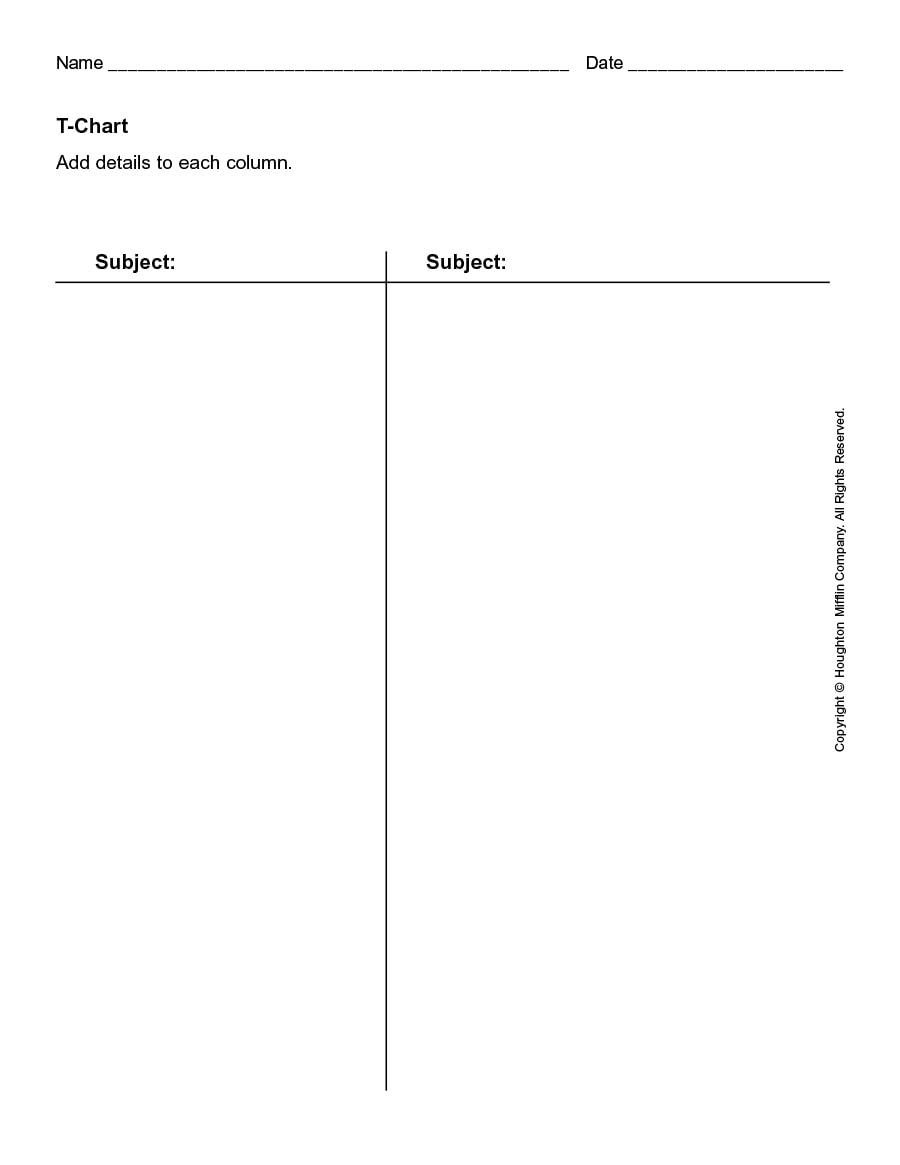
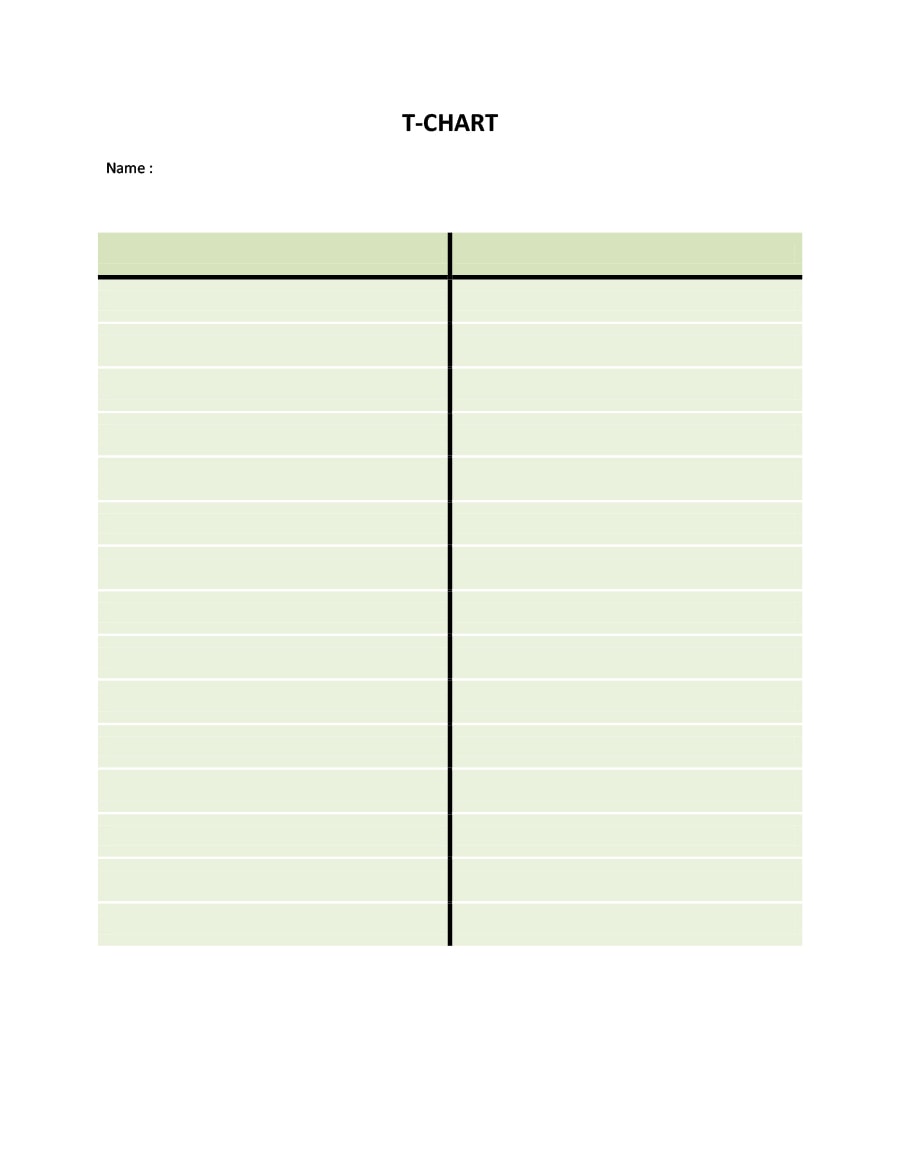
T-Chart Examples

Subjects on where T charts are used
T charts are greatly used in different fields of study to organize information and come up with conclusions. It functions in different fields of study vary, and if you are going to use a T chart template online, you must be able to determine first how to classify your information.
Journalism
At the beginning of this article, it is said that there always two sides to every story. This is the line that journalists live by. When writing their articles or scripts for their news story, it is important to list down all the details first before coming up with a conclusion. Editorial writers and investigative journalists are the crucial types of journalists that do this method the most. For example, a reporter would interview two people with different statements. By using a compare and contrast chart template, they will be able to determine the contradicting statements each person is delivering.
Criminal investigation
You might have watched how the CSI, NCIS or whatever government police agency interrogates their suspects in certain TV series. As fictional as those stories on TV may seem, the interrogation process is what it is in real life as seen on television. It is during this process that the investigators list down the statements of each suspect and compare each, whether they will match or contradict each other. A compare and contrast chart template can come handy during these situations when making a detailed report on the suspects’ statements, or when comparing the statements to the autopsy or pictures of the crime scene.
Business management
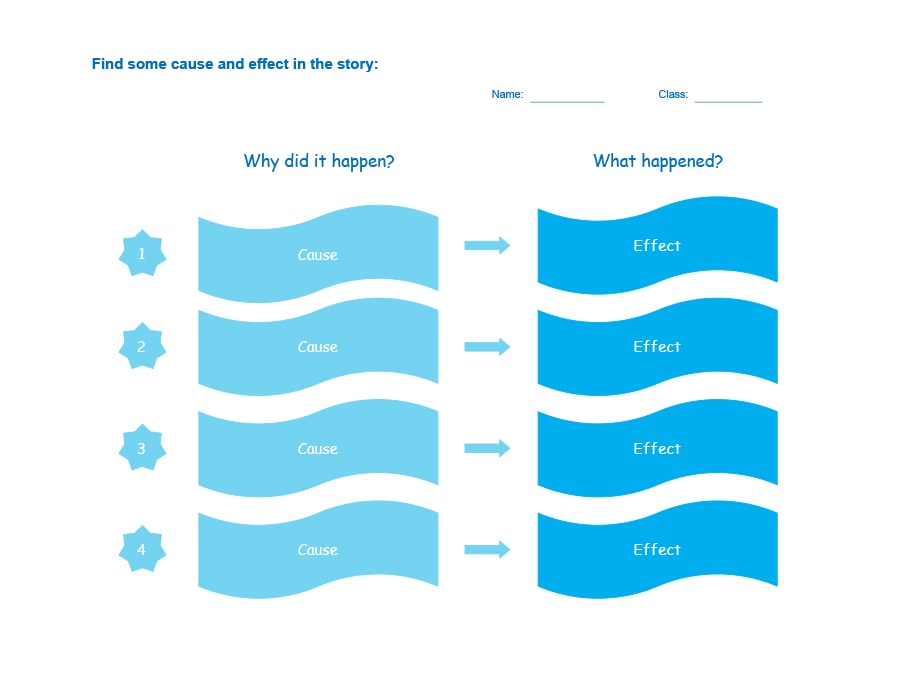
Managing a business or working in a company would require a lot of decision-making. If you are an executive member of the company and want to propose a certain project for your department, you need to list down first the pros and cons or the advantages and disadvantages of your move before making the great leap. A T chart template is a very useful tool especially when you already must present your proposal to the board. A wordy presentation could bore the audiences. In such cases, a T chart graphic organizer is also available online where you can insert images instead of words for better visuals of your report.
Law
If there is a field where case analysis is the main practice, studying law is the course you might want to take. In this field, you are required to analyze certain case studies. Using a T chart template can be helpful in listing down the statements of your client versus the statement of the other camp, or the statements you may want your client to deliver during the hearing and the possible questions that may come after.
Math
Believe it or not, a T chart template can also be used in math. Certain fields of math like algebra, statistics, and accounting make use of the T chart. Accountants need to list the credit and debit of a certain client to drive to a certain computation of their assets, tax requirement or tax refund. Banks greatly use this system as they need to know the credit standing of a certain client. In algebra, the T chart can be used to list the value of x on one side and the equation on the other. This can also be used in grade school math such as finding the greatest common factor or the least common denominator.
Using a T chart graphic organizer can be very effective in grade school math. For example, a problem states that James has three apples while Chase has four. You can make use of a T chart graphic organizer by placing James on the left with his three apples and Chase on the right with his four apples. Children will be able to learn faster through this visualization, and it makes teaching easier for teachers.
History
History is one of the subjects that mostly makes use of a T chart example. The subject can be dragging if students only read paragraphs of timelines and its details. By using a T chart, instructors can make modules that will be easier for students to review by simply creating a chart where the dates are on one side with a summary of events on the other column. While this subject can become a bore, you can lighten up your students while reading their modules through illustrations by using a T chart graphic organizer.
Language
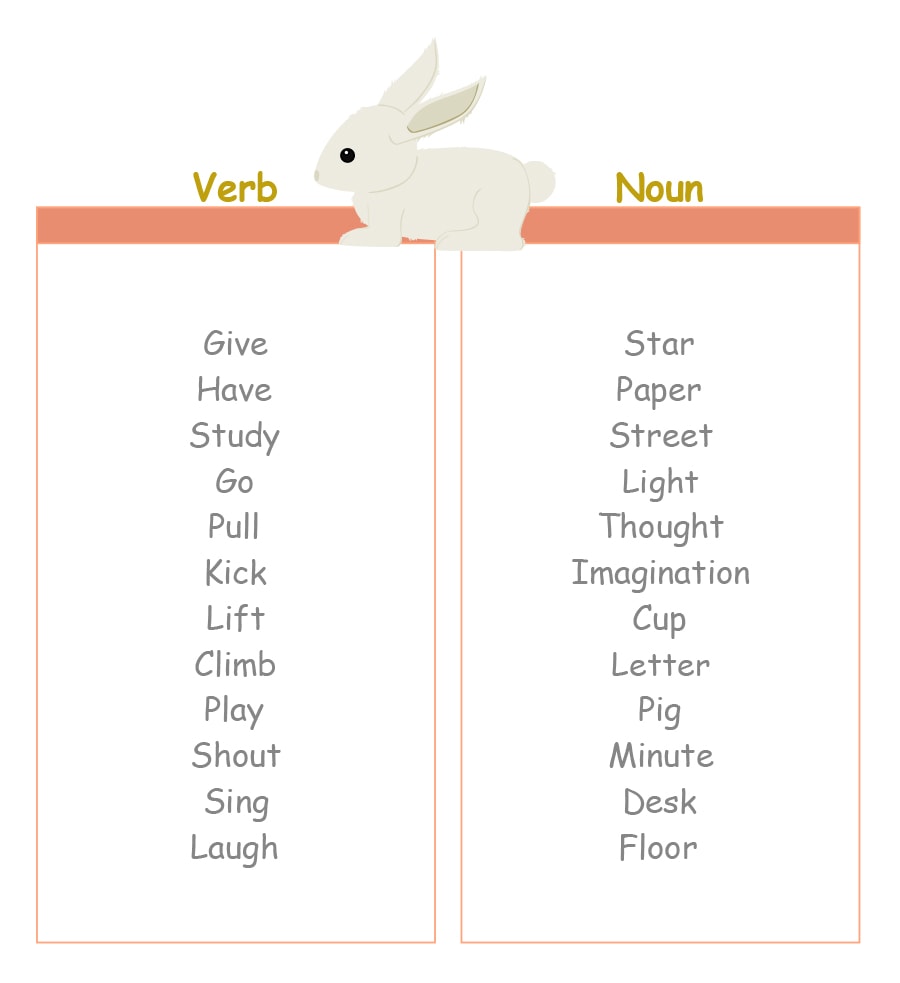
Globalization is a rampant occurrence in today’s world. With the accessibility of airlines to different countries at low rates and the opportunities being opened globally, everyone can go to any country they like anytime. With this requires learning foreign languages to adapt to a foreign country. For people to learn a foreign language easier, instructors use T chart examples to list down words of their own language on one side and its foreign language counterpart on the next column.
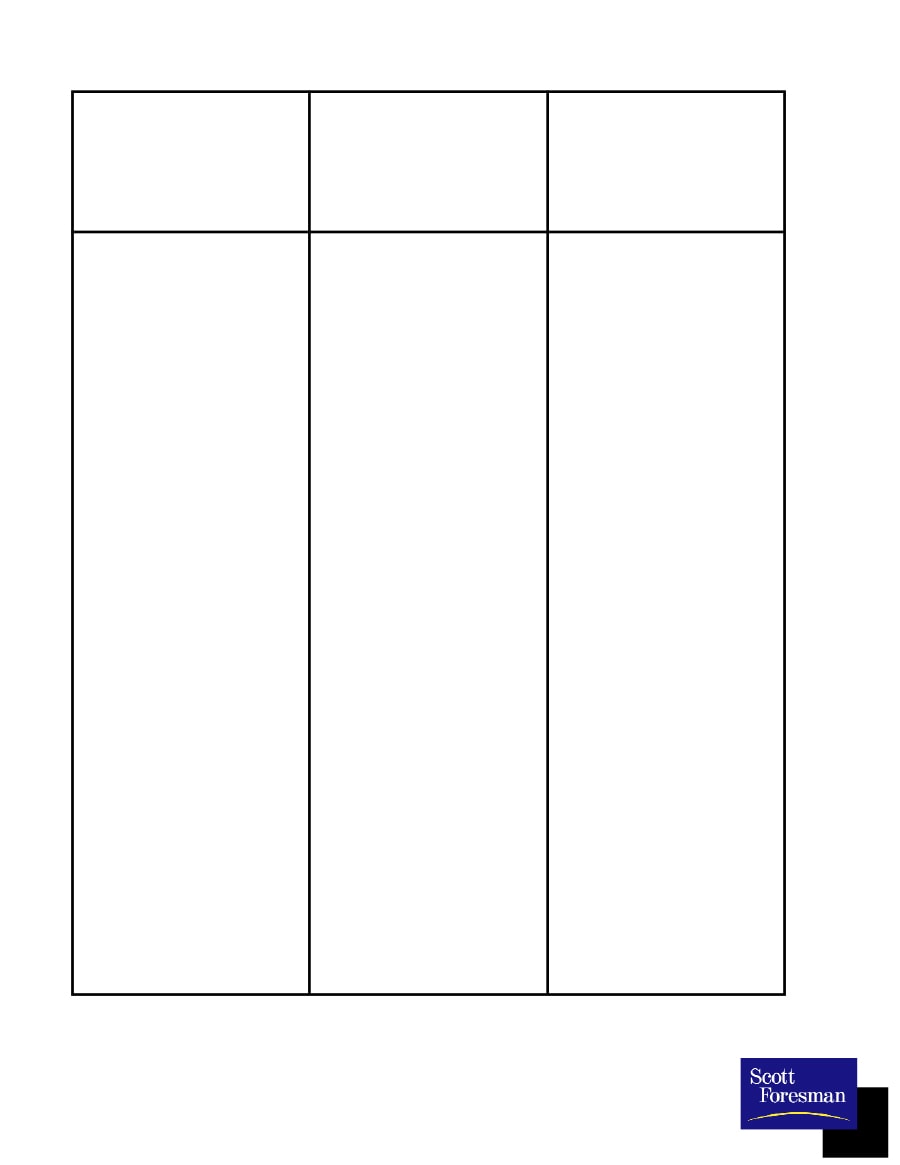
T-Chart Samples
Making your own T chart example
Having your own T chart example is as easy as one-two-three. There are two ways you can obtain your T chart template. First is by creating your own through word processing or spreadsheet computer programs, or by downloading templates online.
The first option to have your own T chart file is by creating your own. There are several computer programs where you can create tables and charts such as:
- Microsoft Word
- Microsoft Excel
- OpenOffice Writer
- OpenOffice Calc
- Lotus 1-2-3
The most commonly used among these programs are Microsoft Word and Excel. However, the procedures in creating a T chart are all the same.
For Microsoft Word and OpenOffice Writer, you can create your own T chart by following these steps:
- On the menu bar, click Insert, then click the Table button.
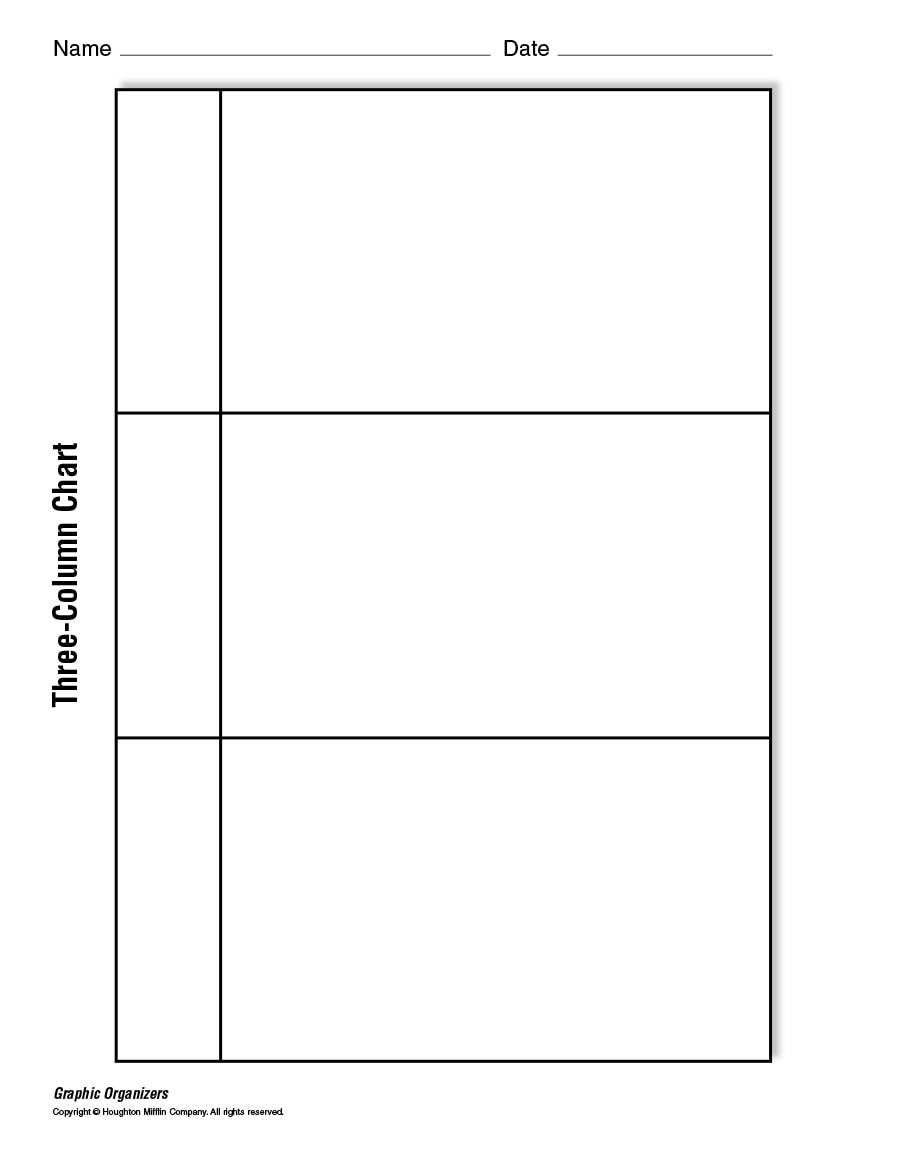
- Once you click the Table button, a dropdown button displays the number of columns and rows you wish for your table to have. You can either select a 2×2 table or a 2×3 table. If you’re going to use a 2×3 table, save the first row for the title of the table.
- For 2×3 tables, highlight the first row of the first and second column. You can either right click and select Merge Cells, or go to the menu bar and click Layout and select Merge Cells. On this cell is where you write your title or topic.
Creating charts is simpler with spreadsheet programs like Microsoft Excel and OpenOffice Calc. The latest version of MS Office, the MS Excel 2016, has made it easier to format your tables. Just follow these steps to create your own T chart using a spreadsheet program:
- Highlight two columns and two rows. Go to the menu bar and select the Insert. Click Table.
- A pop-up box will appear, containing the information on the cells that you highlighted. Click OK.
You have your own T chart after following these steps for your preferred computer program. You can adjust the width of the second row to leave space for the data you are going to input. This can also be done in PowerPoint if you’re going to use the T chart for your presentation. Once you insert a new slide, you can choose a layout in the Home menu and select the Title & Content layout.
Another option for you to acquire a T chart is by downloading online. There are websites that have ready-made templates for free, while some can be purchased at a low price. Most of these templates are customized into a T chart graphic organizer for certain topics and other purposes. Some are made for instructors and some for students. Some of them are designed for instructors and students where learning must be stimulated through colors and visuals, while some of them are designed plainly for a more executive and professional look for corporate purposes.
When you search for T charts online, you might find templates in DOC or PDF formats that you can readily download and use and print. However, there are websites that let you customize your T chart. Once on their webpage, they will ask you to fill out a form where you need provide the page title, left side title and right-side title. More likely, these pages allow you to create a compare and contrast chart template. There is also a prompt for the paper size and whether you would like to include the name and date as headers in the page.
Customizing your compare and contrast chart template online is also easy. You can go to a webpage that offers customized compare and contrast chart templates and register for free. Once you have registered, you can start creating and downloading your own T chart template.
Convenience for all
So much has been said about what a T chart is, how and where it is used, and how to acquire your own T chart template. The T chart template indeed has been useful to many for its ability to compare two sides of every topic, paralleling problems and solutions, stating facts and opinions, and declaring the advantages and disadvantages of each point. But who will benefit most in using a compare and contrast chart template?
T charts can be most useful to teachers in their profession. While teaching can be a passion, making a lesson plan, writing modules and creating presentations for the students are a grief to some instructors. It is easy to come up with any learning module, but being able to let the students understand your lessons is the real deal. By using a T chart, it has become easy for teachers to show the differences between certain topics, pose problems and its corresponding solutions, and provide summarized details for each bulleted topic. T charts are very effective in teaching children as well especially if it comes with illustrations on each side.
Apart from creating teaching manuals using T charts, the downloadable versions can be printed and be used by teachers for quizzes to the students.
Corporate offices also benefit from using T charts. Businesses often come into certain decisions especially when the company is trying to expand or improve their sales. Before coming to a decision, the executives list down first the pros and cons, and the advantages and disadvantages of their decisions. If I take this step that I list on the left, it can affect another element in the company which I will write on the right side of the chart. The T chart plays an important role in the decision-making process of corporate offices.
Scientists also make use of T charts most of the time. Information is often clattered during experiments. Without a chart to list down the details and the results of each experiment, they surely won’t be able to come up with sound conclusions.
Conclusion
There are tools that can help people in their learning journey or decision-making process. By using charts, it is easier to differentiate and specify the information we need to look into. One tool that can help classify data is the T chart.
T charts helped people from all walks of life like students, teachers, and working professionals in their learning and decision-making journeys. Mainly, the T chart helped them compare, classify, state and summarize information, indicated solutions to problems, interpreted foreign languages, and a whole lot more. With this tool, students, teachers, and business all grew because of a simple step in clearly laying out clattered information.
")
")
")