
A flow chart is a visual representation of the steps of a certain process. But a process flow chart isn’t limited to just computer work you can apply it to almost anything that involves a process. Constructing this chart is one of the first activities in an effort of process improvement.
Contents
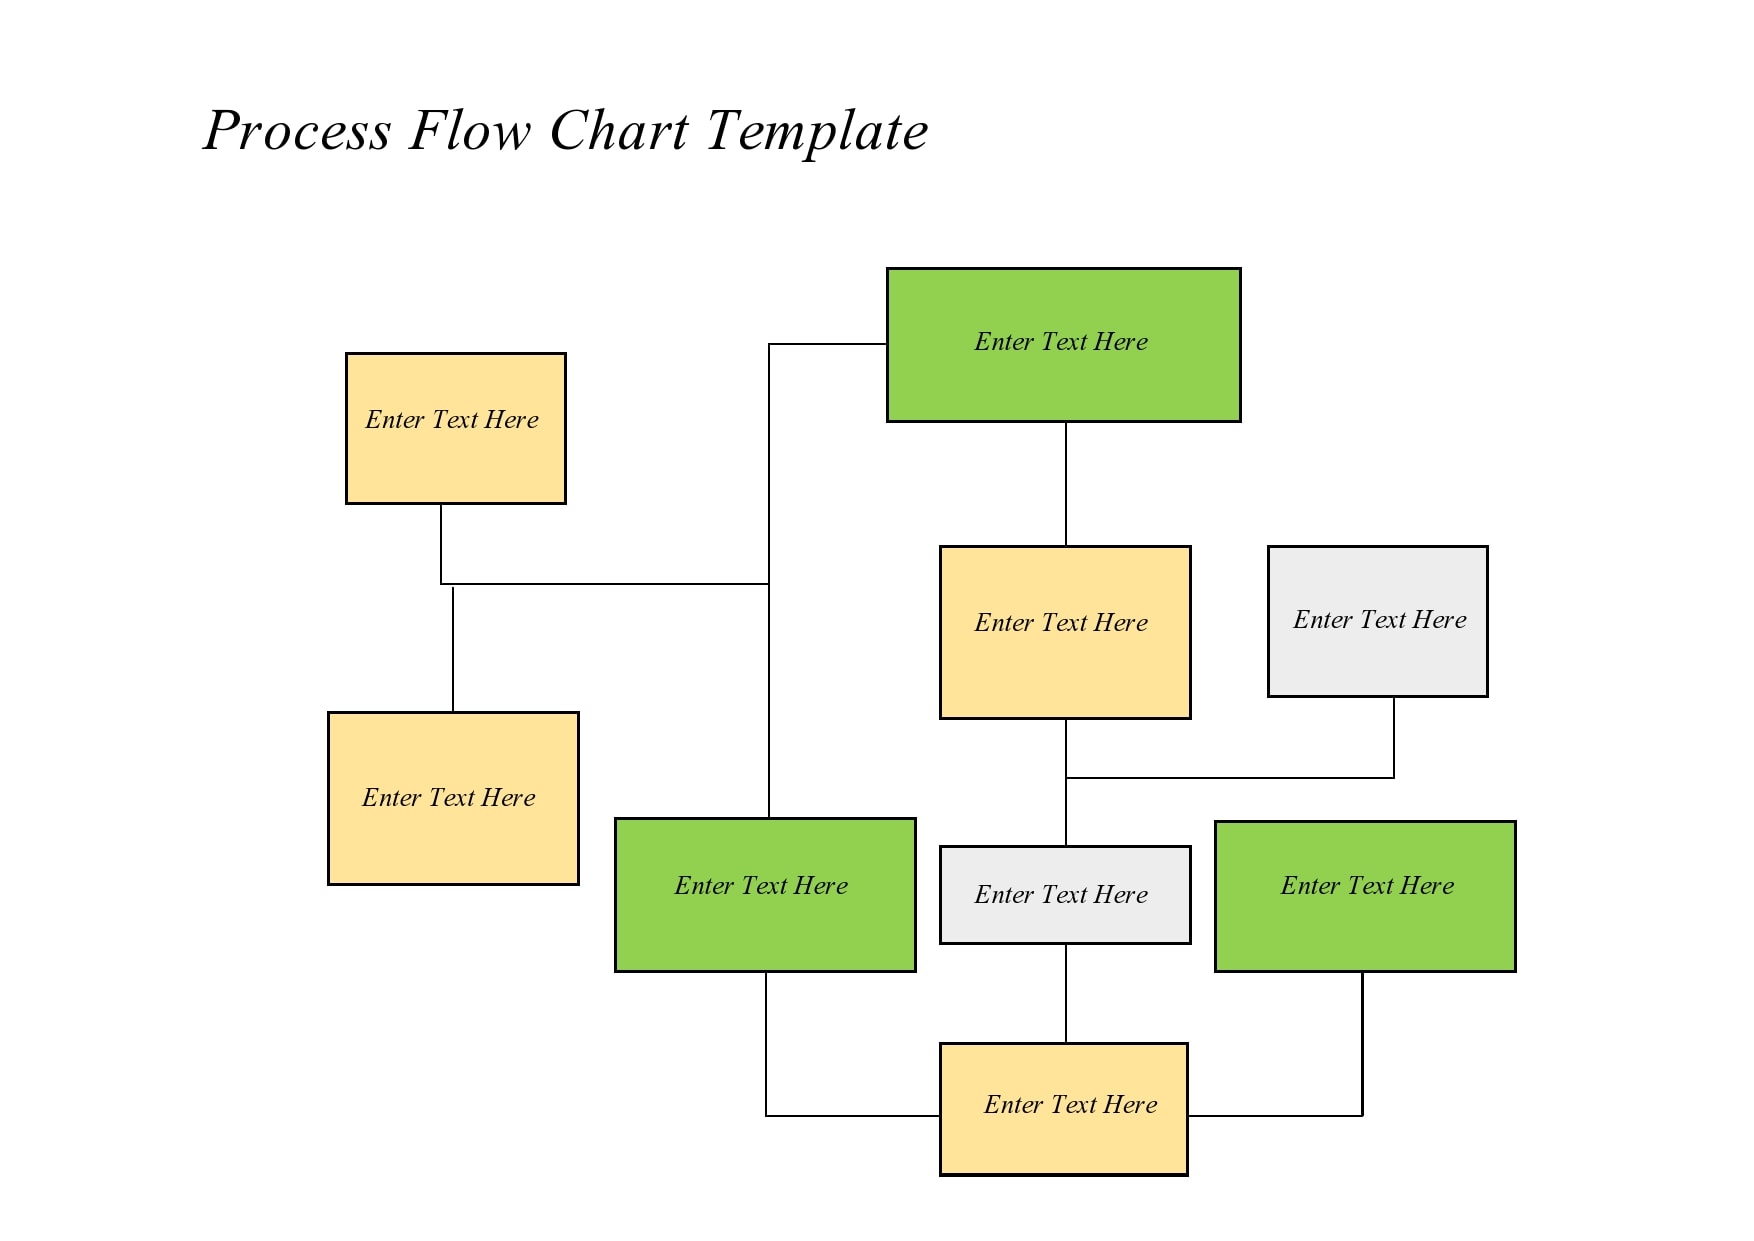
Process Flow Charts

What is a process flow chart?
The use of a process flow chart is a very important part of the process of business mapping. With it, you can visualize your processes and thus, making it a lot easier to understand. Aside from this, you can also use a process flow diagram for:
- Understanding how the process works
Since the chart is a visual representation, it helps you understand things better. - Improve the process
After you understand how the process works, you can think about how to make potential improvements. You can even choose to remake the process and change how the whole thing works. - Standardize the process
If you have recorded your processes, you have the assurance that everyone in your team will be on the same page about how to perform the process. Otherwise, your team members will waste their time trying to figure out how to carry out the process.
By increasing your understanding of the flow of people, resources, and information, this can be a great tool to use to improve any process vastly. The more information you incorporate into the diagram, the more useful it will be.
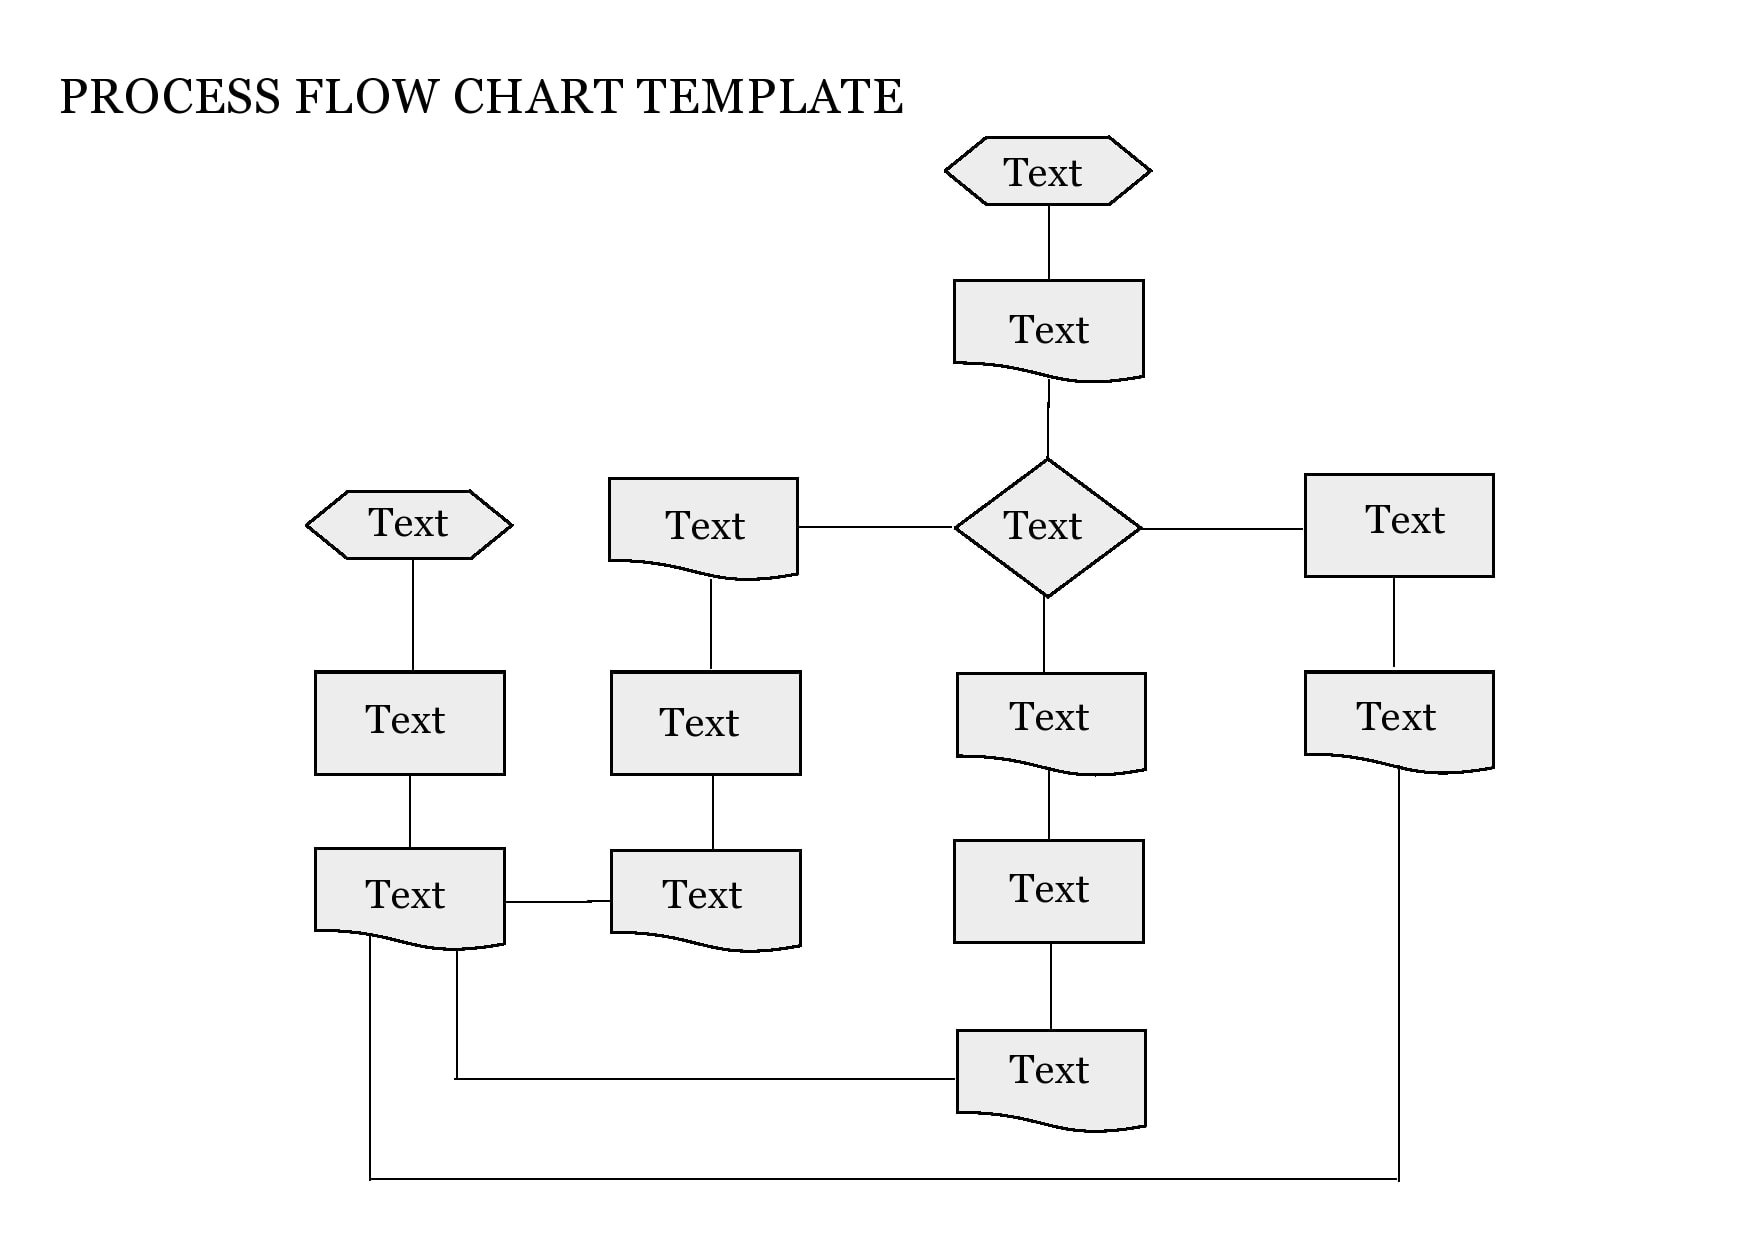
Process Flow Diagrams


What are the main flowchart types?
Another way of defining a process flow chart is that it is a visual representation of a workflow, process or algorithm. It can be extremely versatile as it helps make the process simpler, thus, allowing for easier troubleshooting. Following are three of the most common types of flow chart templates:
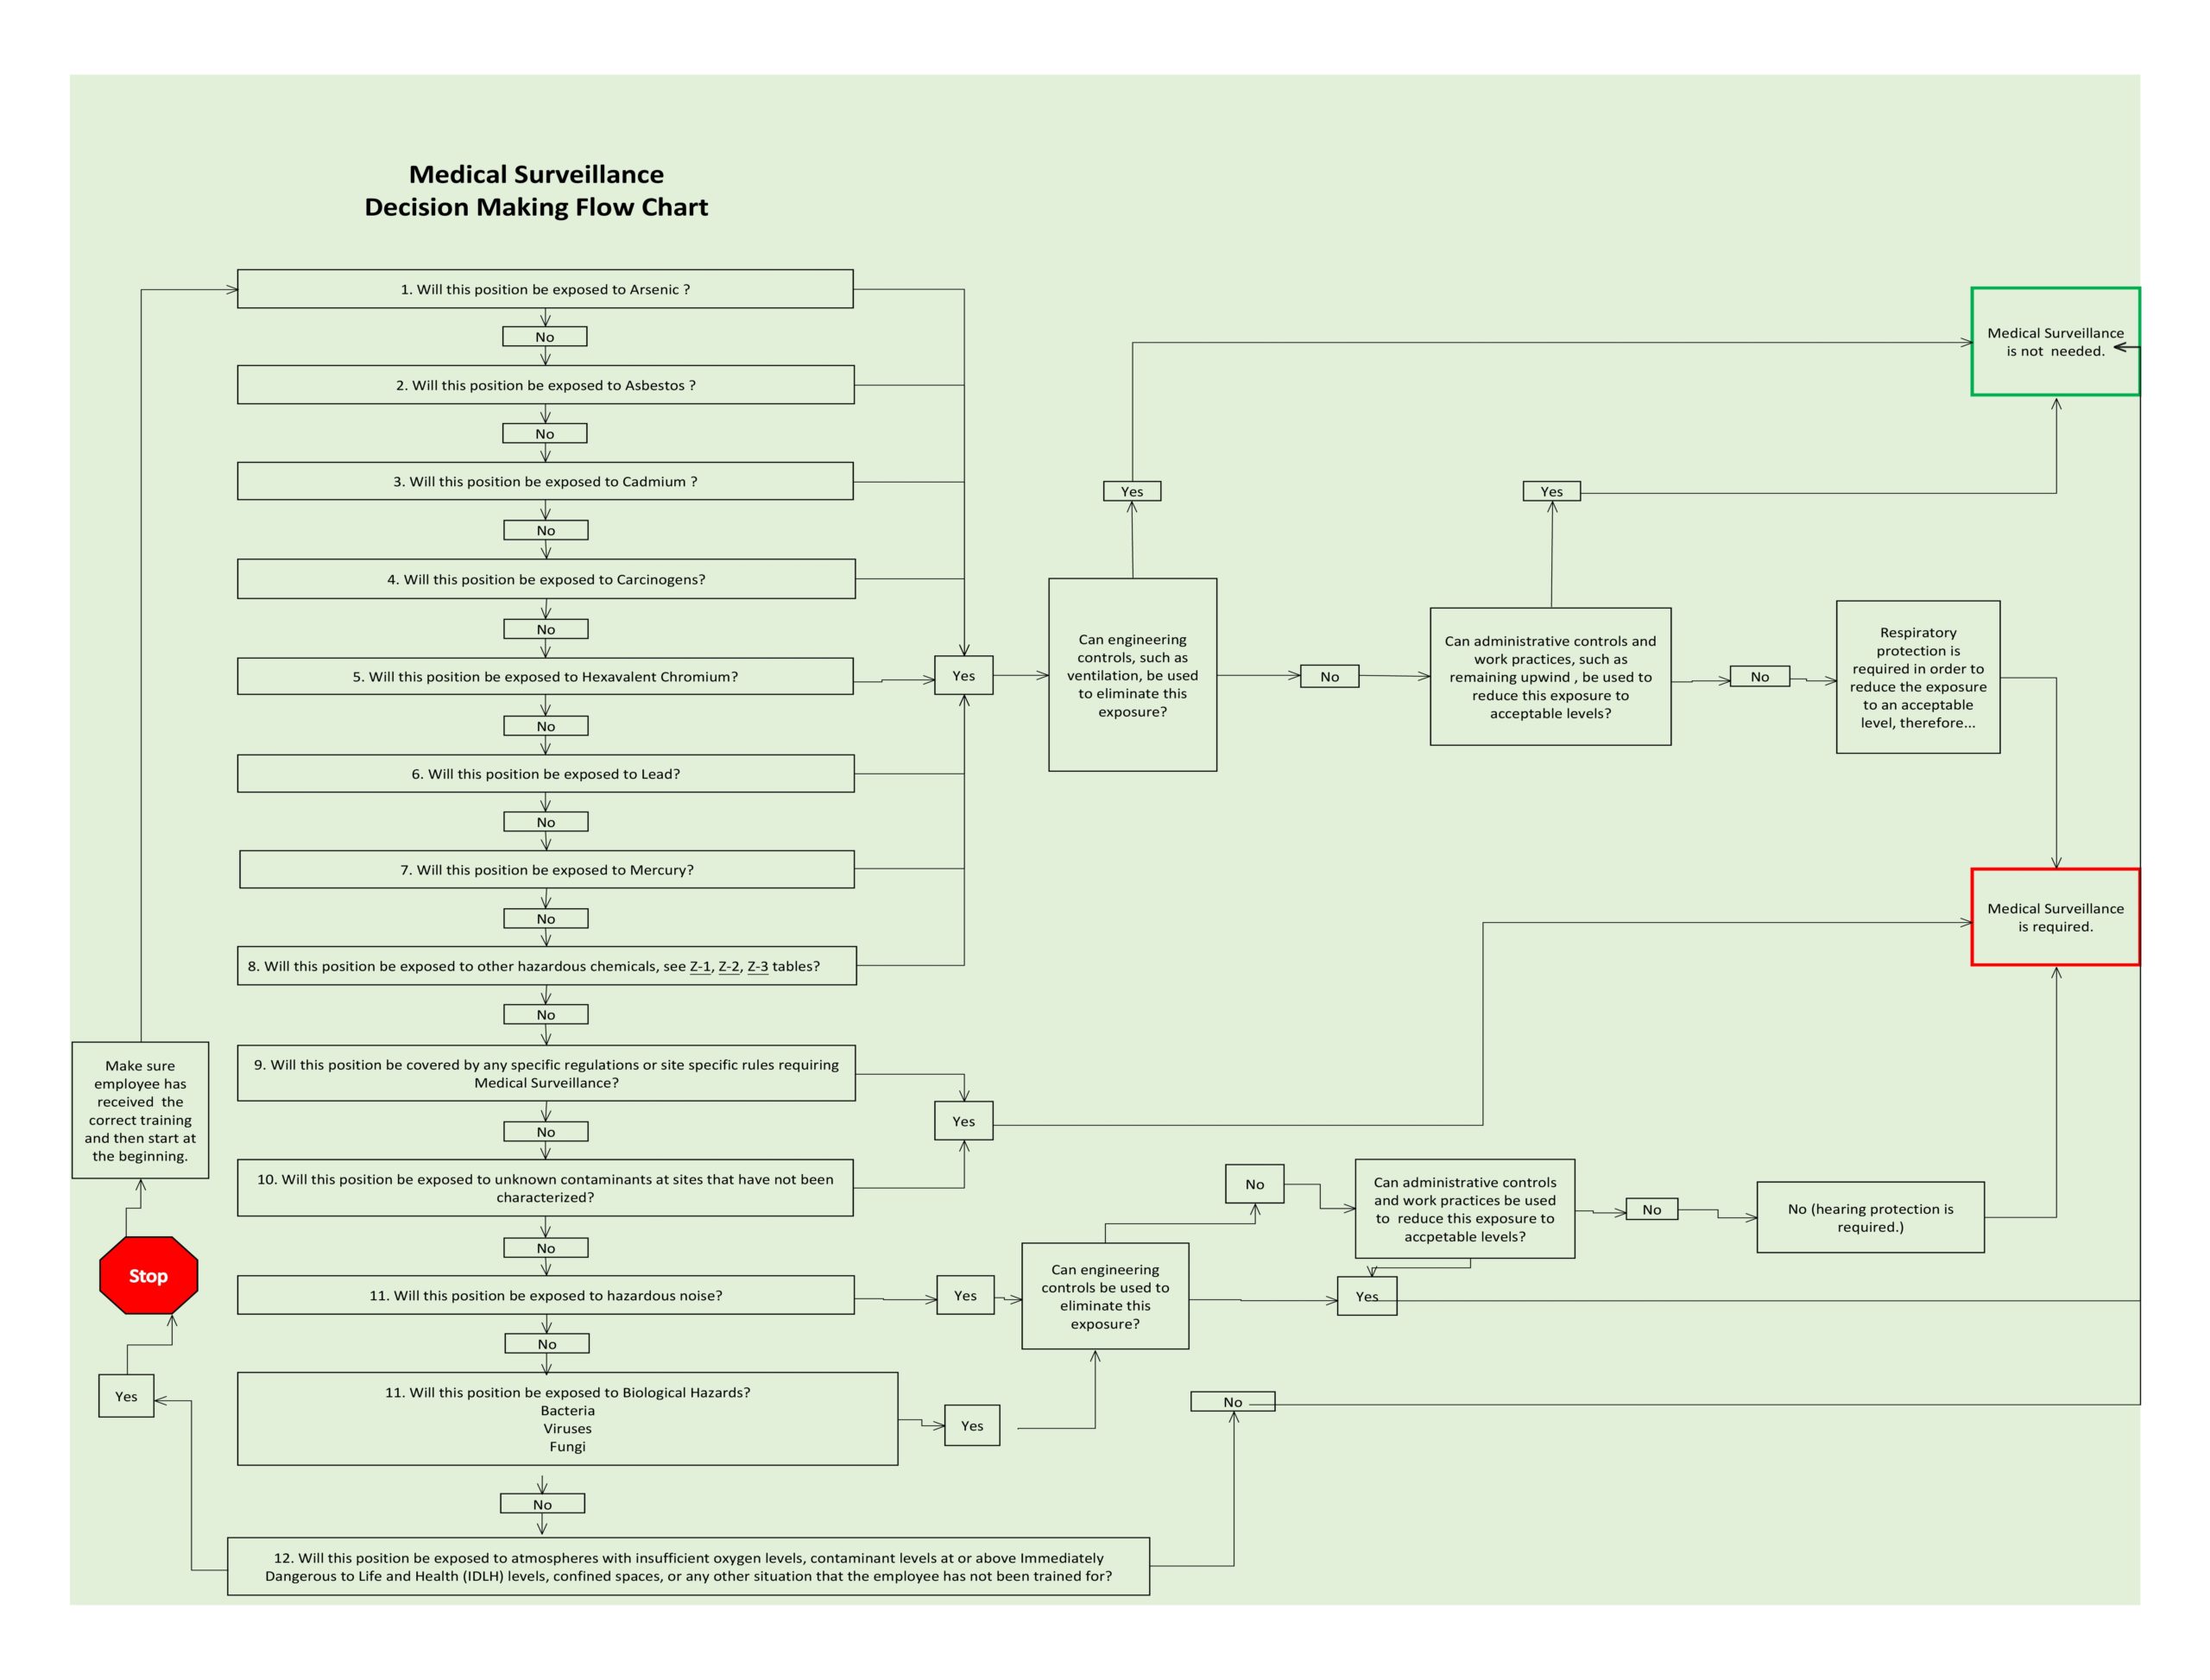
- Process Flowchart
This is a diagram that analyzes and illustrates the overall flow of steps involved in the production of a service or product. You use this chart in the chemical industry or process engineering where there is a need to depict the relationship between main components. You can use it for:
Electrical power plants
Green energy like solar and wind power
Irrigation and piping systems
Natural gas systems
Petroleum and oil refining
Water processes and treatment - Data Flowchart
This is one of the most basic tools used in structural analysis. It shows different ways to process data. You can use it for:
Data management
Modeling process aspects
System overview
Visualization of data processing
Where the data comes from
Where data will go to - Business Process Modeling Diagram
This is a graphical representation used for specifying the business processes in a workflow. You can also use it to create graphical models of your business’ process operations. This chart can help you with:
Analytical representation of business processes
Illustrating an organization’s business processes
Process improvement
Simplifying the understanding of business flows, processes, and activities
Why do you need a process flow chart?
You create and use a process flow chart to get a better understanding of the basics of your business. With it, you can identify several factors to determine the details and fate of your company. Moreover, you can also use it to help cultivate your knowledge regarding your business’ structure.
- To determine if you need to make modifications
Once you understand a process and how it works, you can automatically have the knowledge of how to make improvements on issues associated with your business. When you understand how the process works, it becomes easier for you to delete, rectify or create steps for the process. - For process standardization
When you haven’t explained the process fully to your workers, they will think of ways to complete their work. After all, it is their duty to do so. But this can result in a lot of chaos in the workplace.
This is why a workflow diagram is important. You can use it to explain the entire process to every employee so they know exactly what to do and they can work unanimously. - Finalizing procedures
You can use the chart to create your final SOPs. These provide details about the tools and methods used in a process. Having an SOP gives you a comprehensive overview of the necessary steps in the process that everyone should strictly follow.
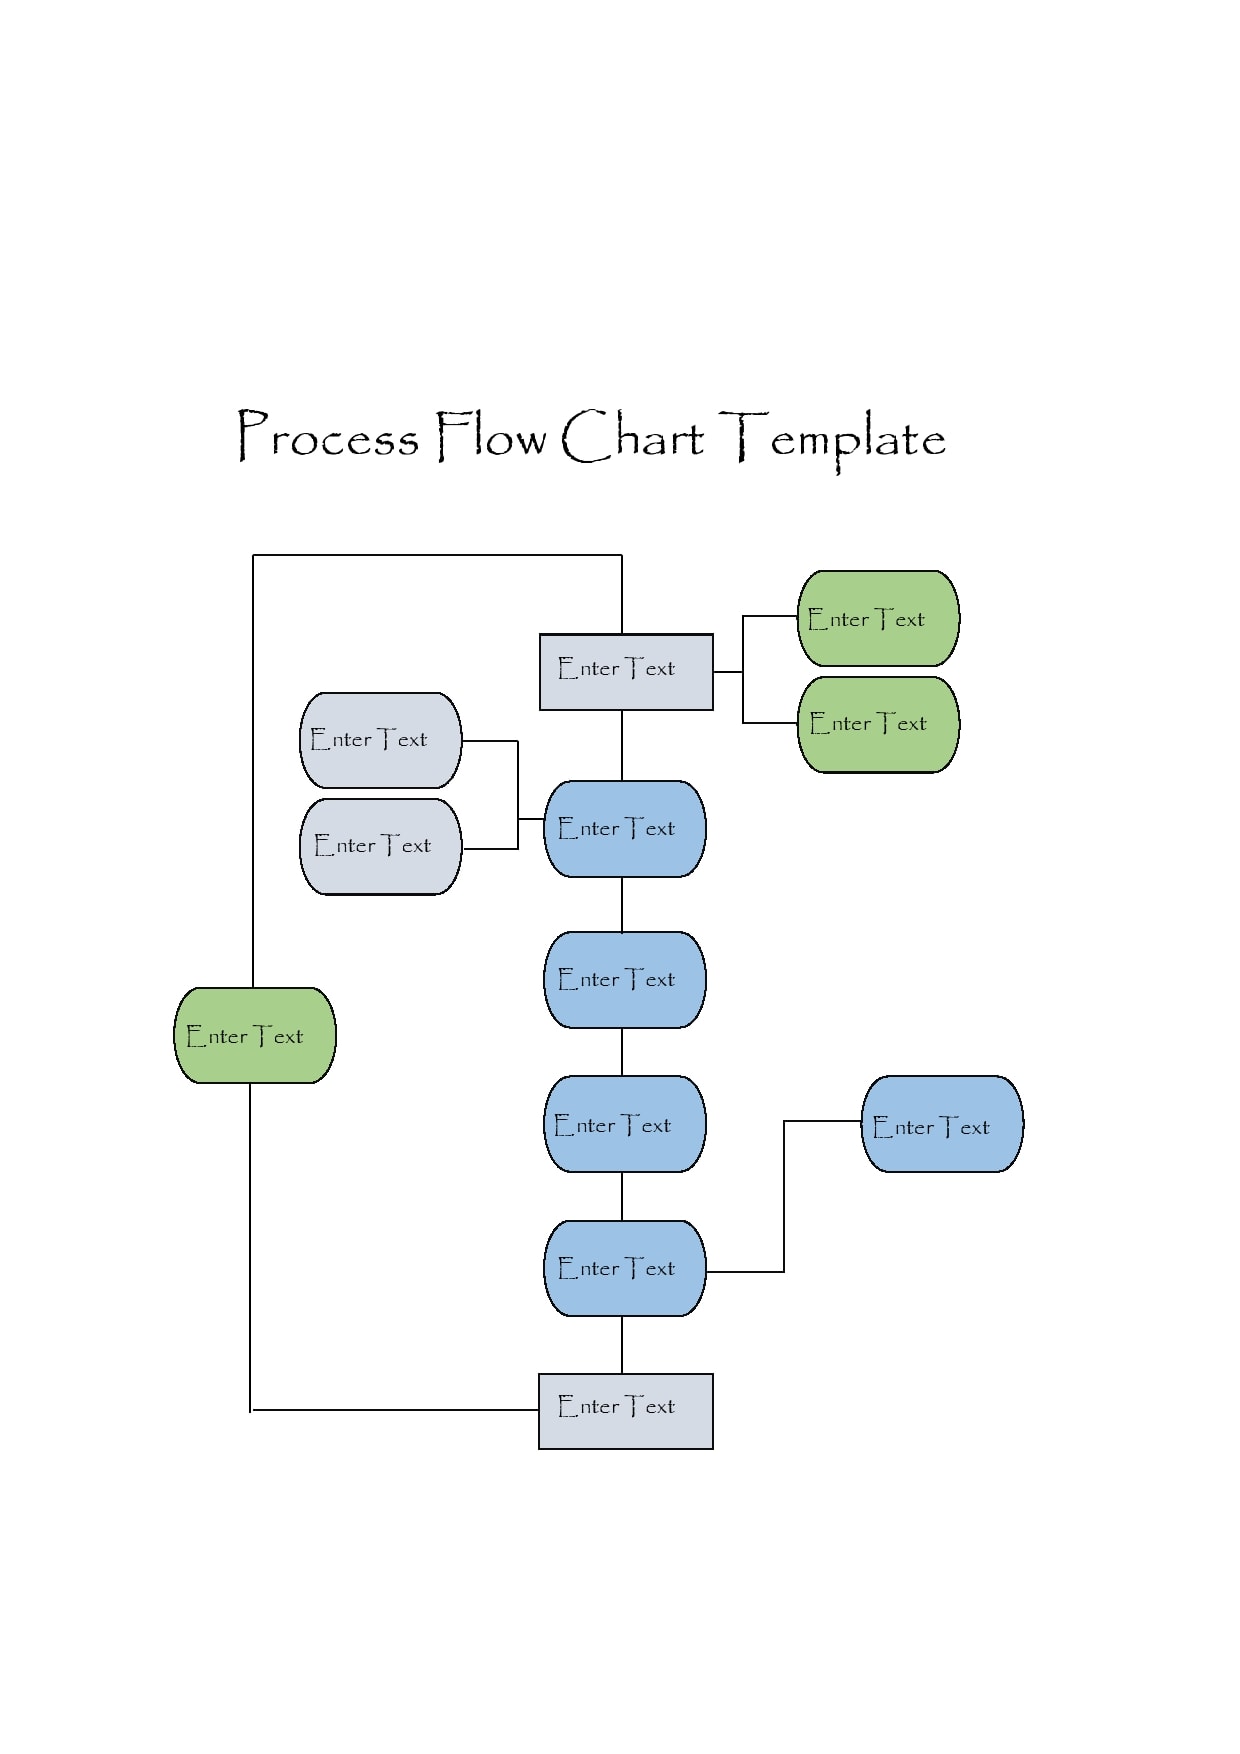
Workflow Diagram Templates

How do you create a process flow chart?
Just looking at a process flow chart would make you think that it isn’t that difficult to create one. But it is one thing to view at the process from a management’s point of view and it is another to understand what it’s made of. To create your own process flow chart template, follow these steps:
- Decide first if you require a process workflow chart
Make sure that the creation of a flowchart is the appropriate tool for the job, before you start learning about the process. For instance, if your goal is to analyze the process from a top-level point of view, you should consider using other tools. Although flowcharts are great for detailing the various steps in a process, they may not be very useful for certain perspectives. - Gather the information you need
You need to gather all of the necessary details needed for the flowchart, especially if you were the one working on the process. At first glance, working on a flowchart may seem straightforward or simple but its creation involves a lot of smaller details to compose it.
To get a better understanding of the inner workings of a process, you should consider consulting with different levels of employees. Set up a brainstorming session with them. You might even pick up ideas on how to make improvements. - Create your process flow chart
After you have gathered all of the necessary information on how a process works, you can start illustrating the flow chart. Remember to keep things simple and make use of the basic symbols. If you want to use a better option, although it is more complicated, you can use the Business Process Modeling and Notation.
This is a standardized type of methodology for the documentation of processes. Following the BPMN model might make it easier for your management, employees, and consultants to comprehend the whole process.

")
")