
People involved with certain projects may want to keep track of its progress and the progress of each of its elements. A very useful tool in determining this progress is a Gantt chart as this illustrates the start and completion dates of such elements. It also includes other information like resources, tasks, dependencies, and milestones.
Contents
Gantt Chart Templates

How does a Gantt chart work?
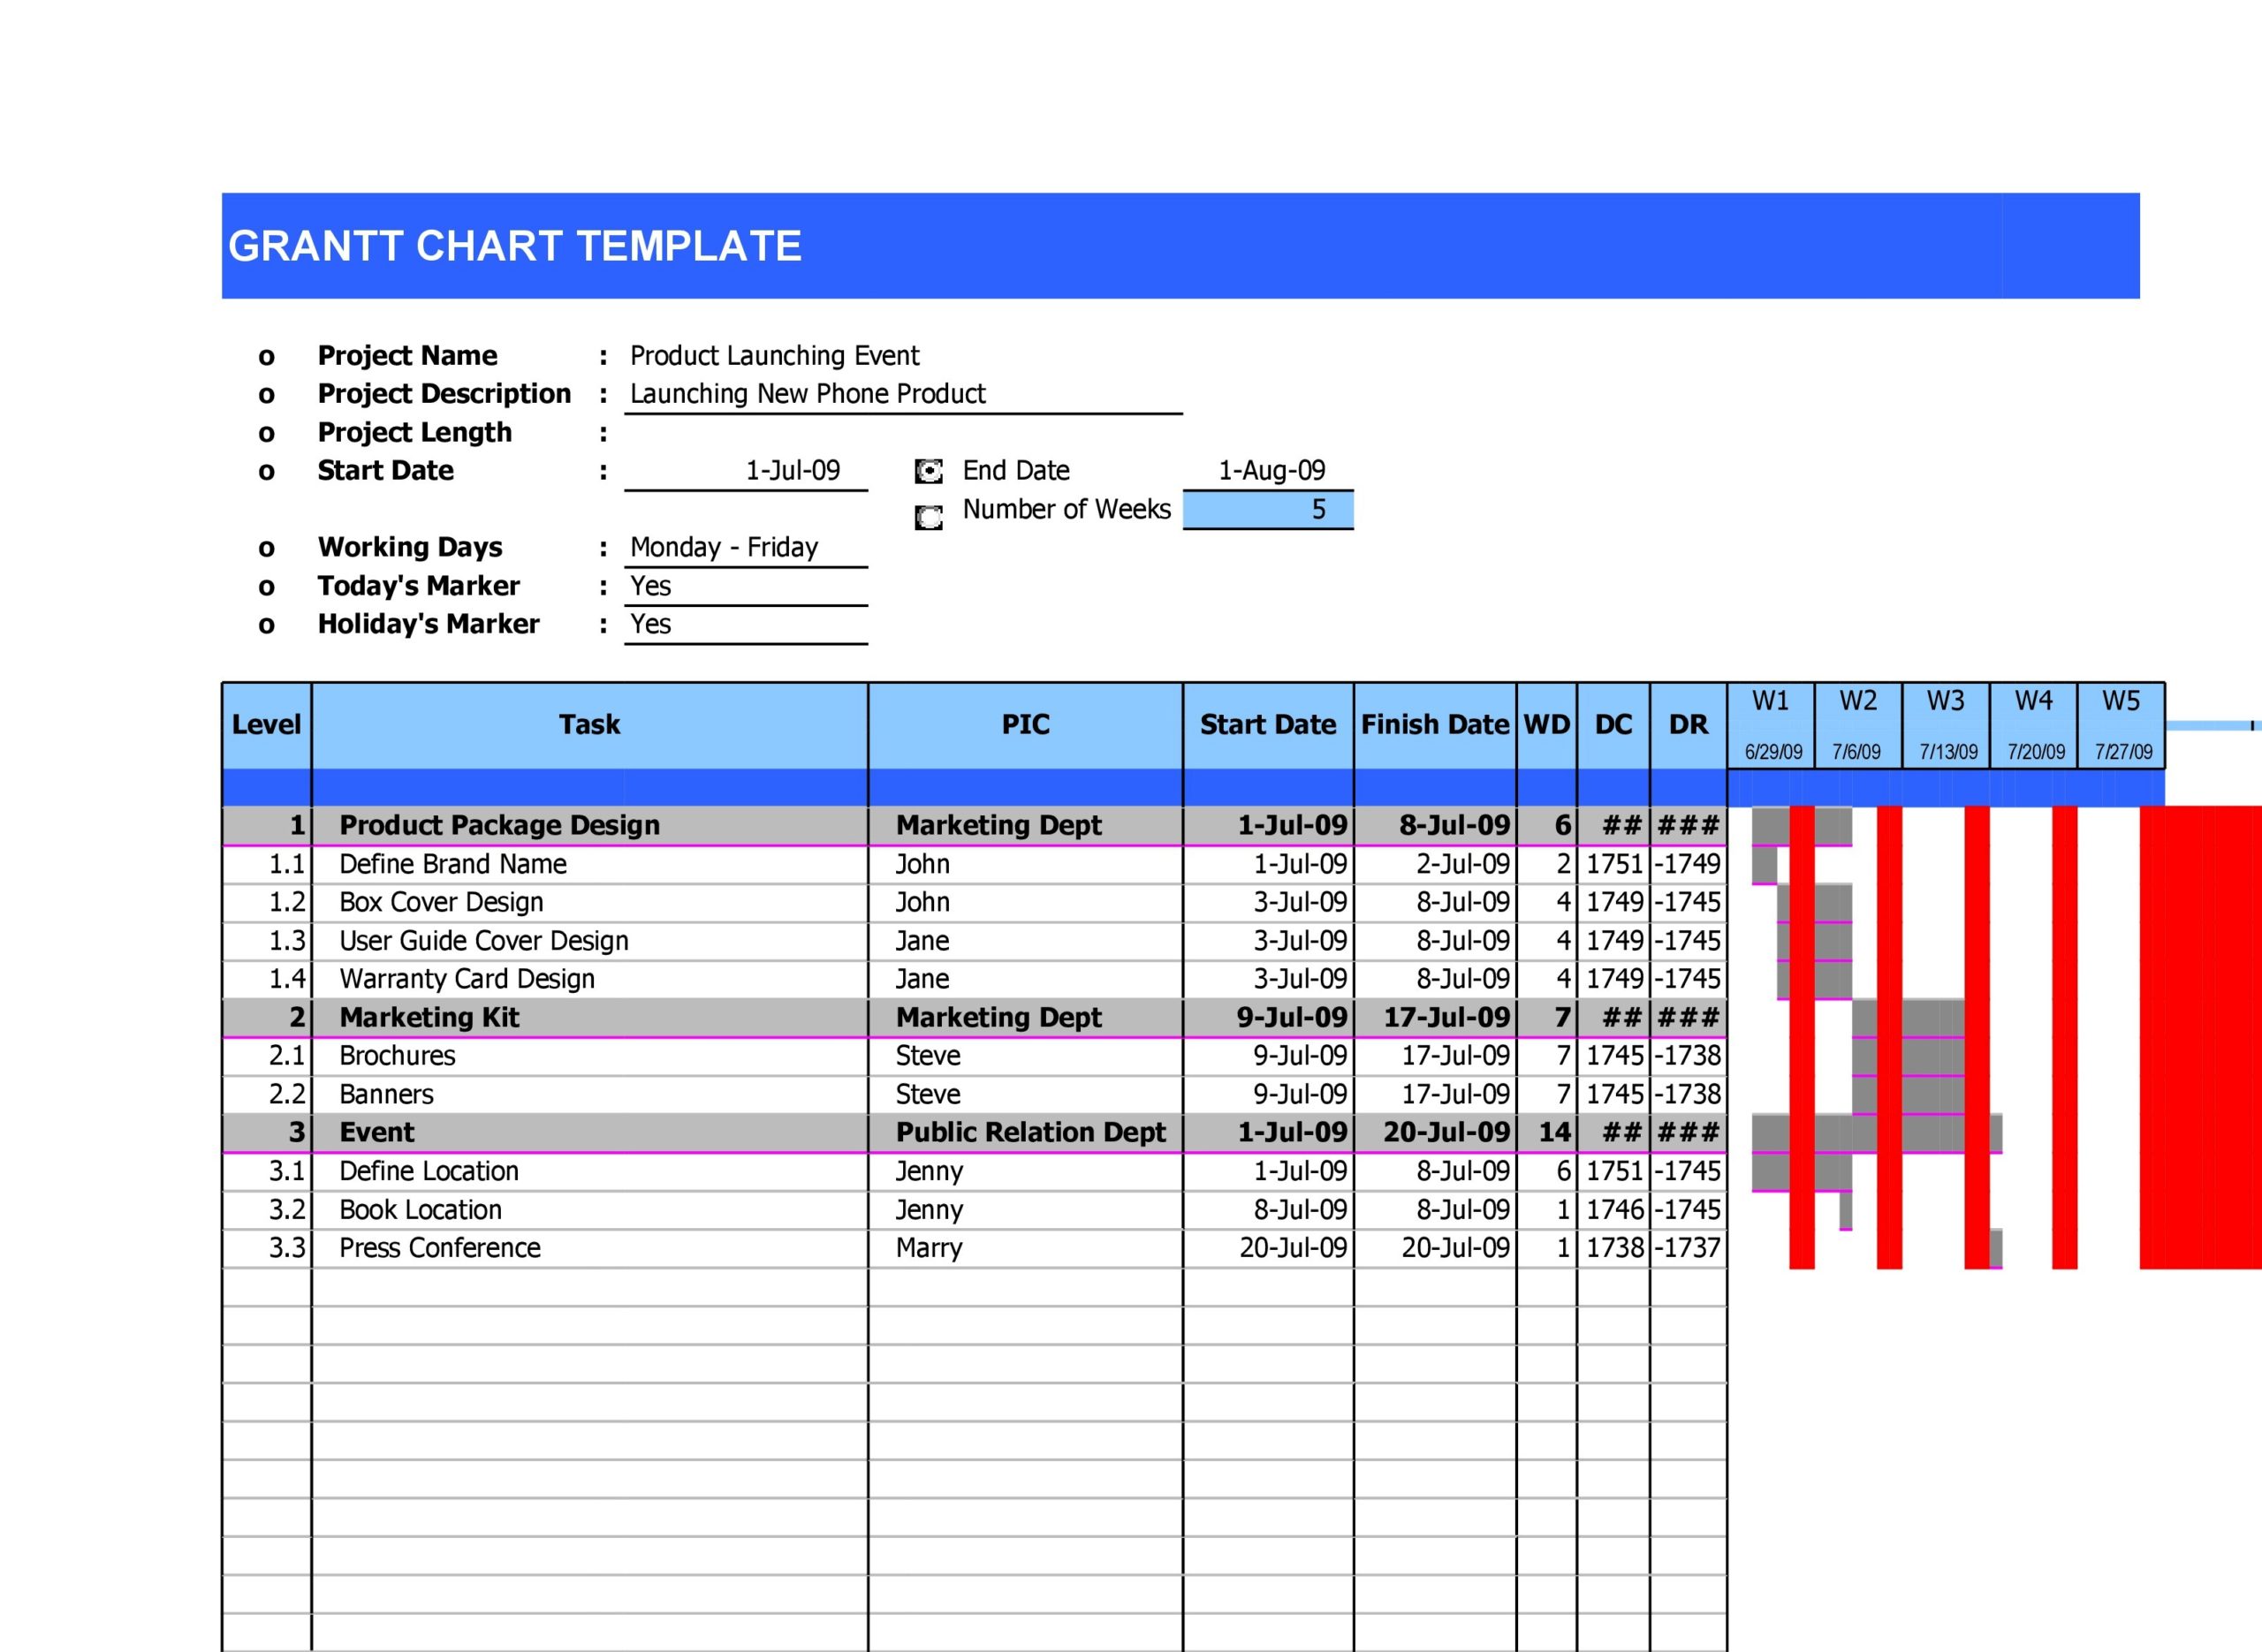
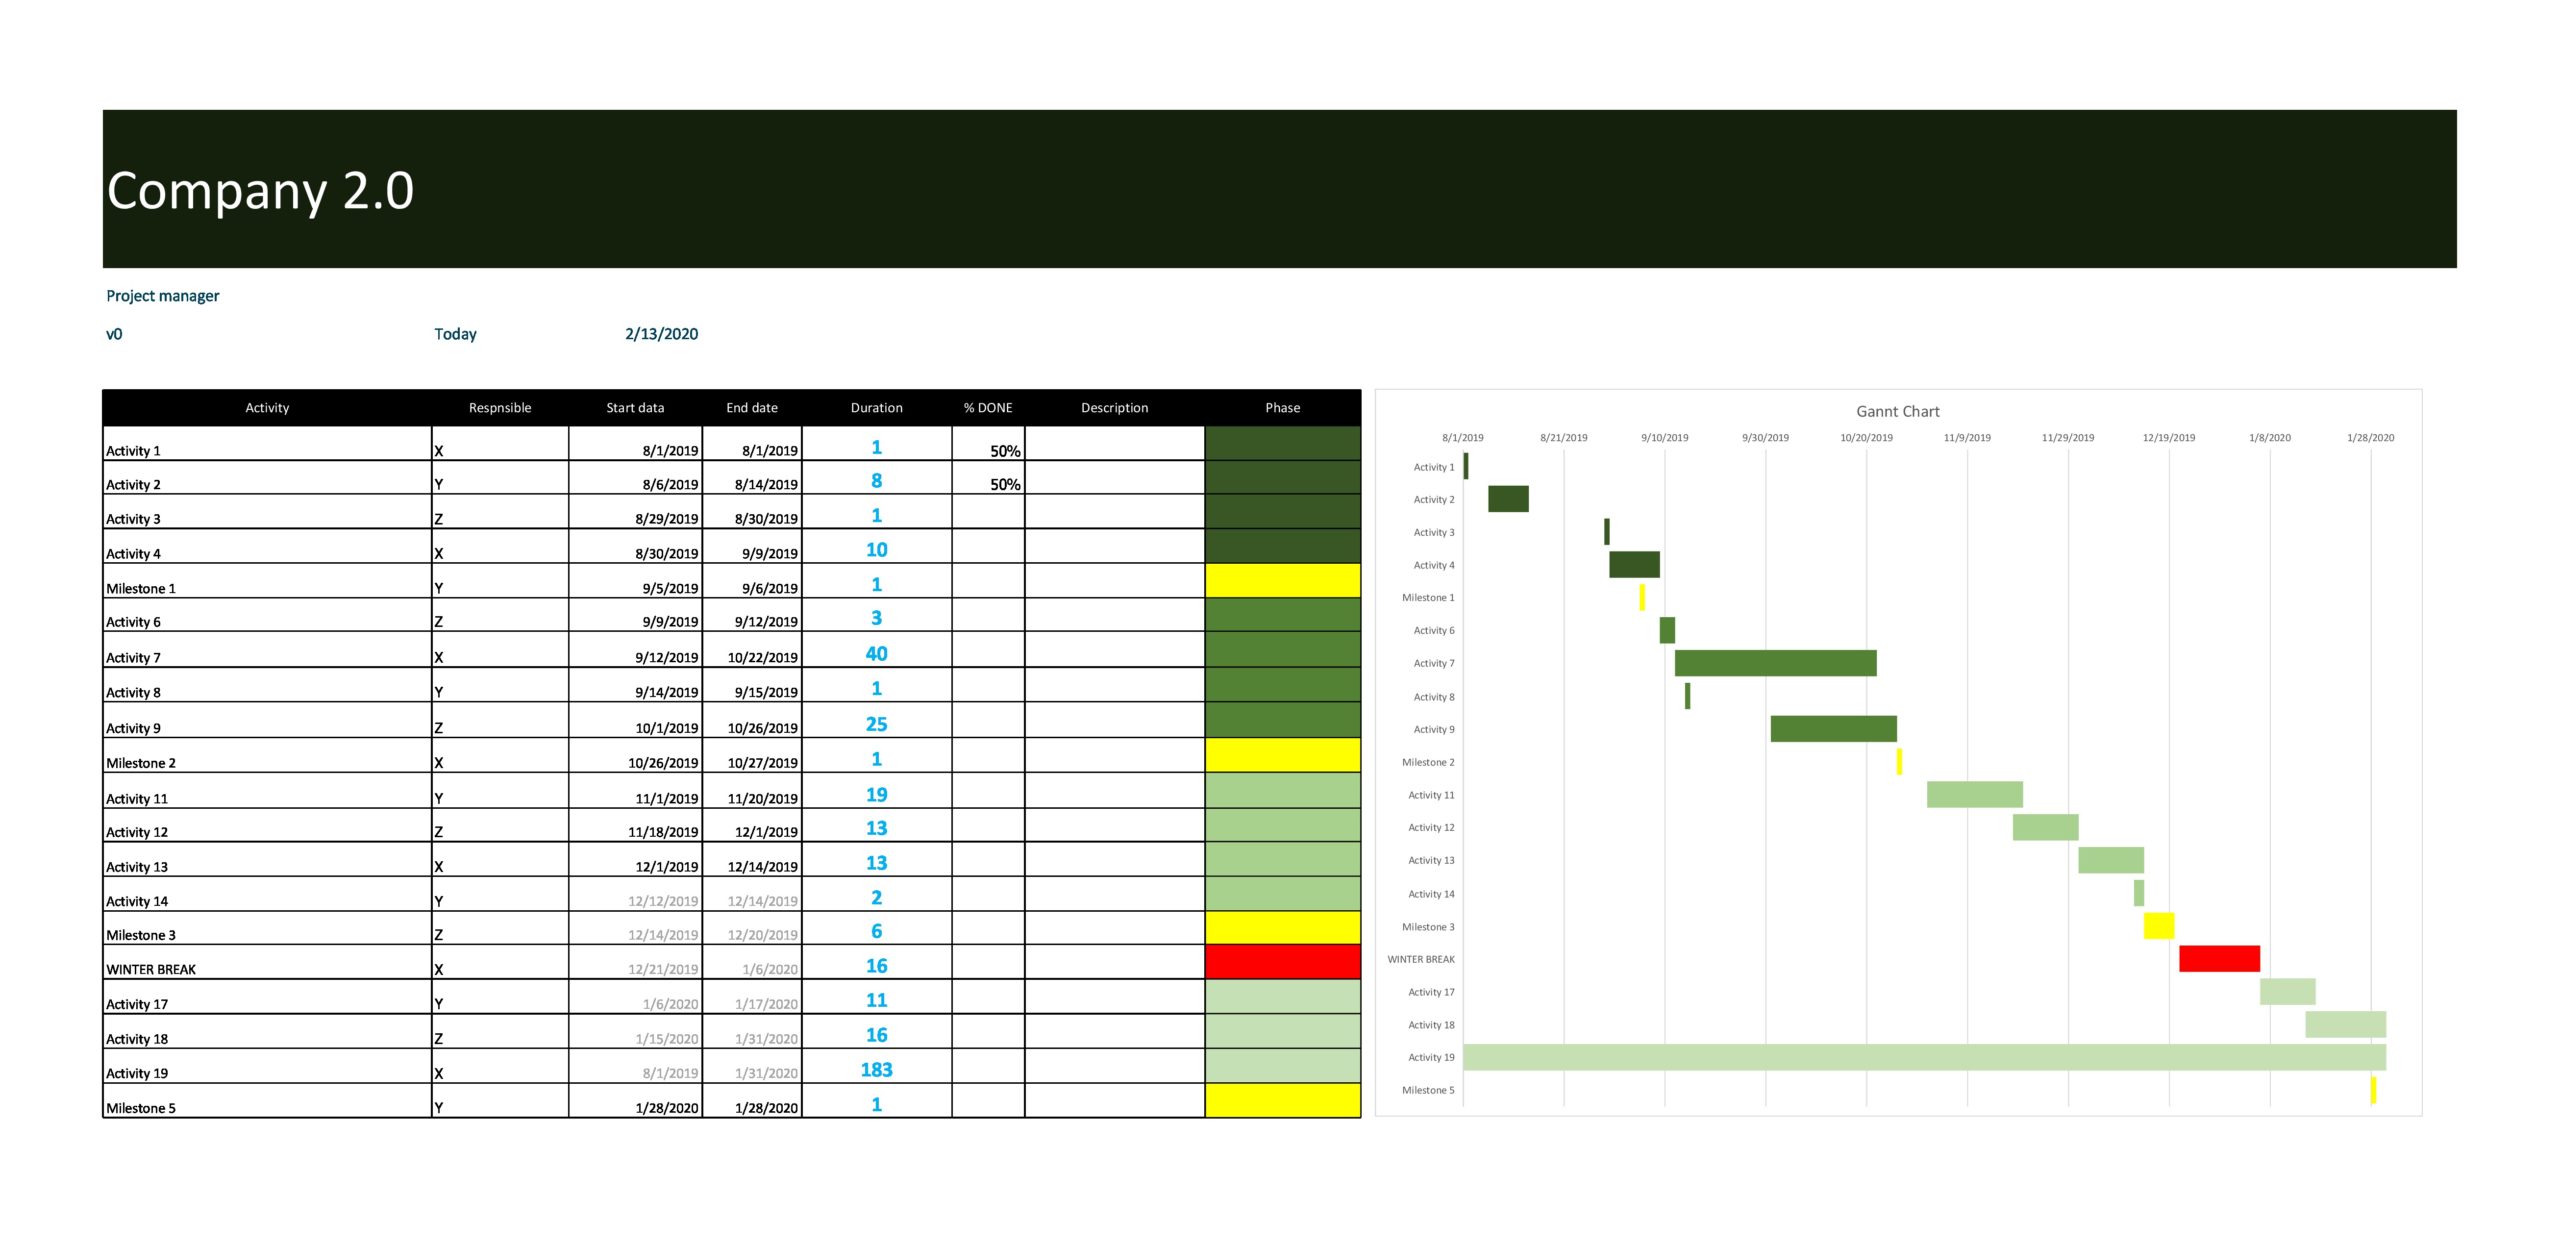
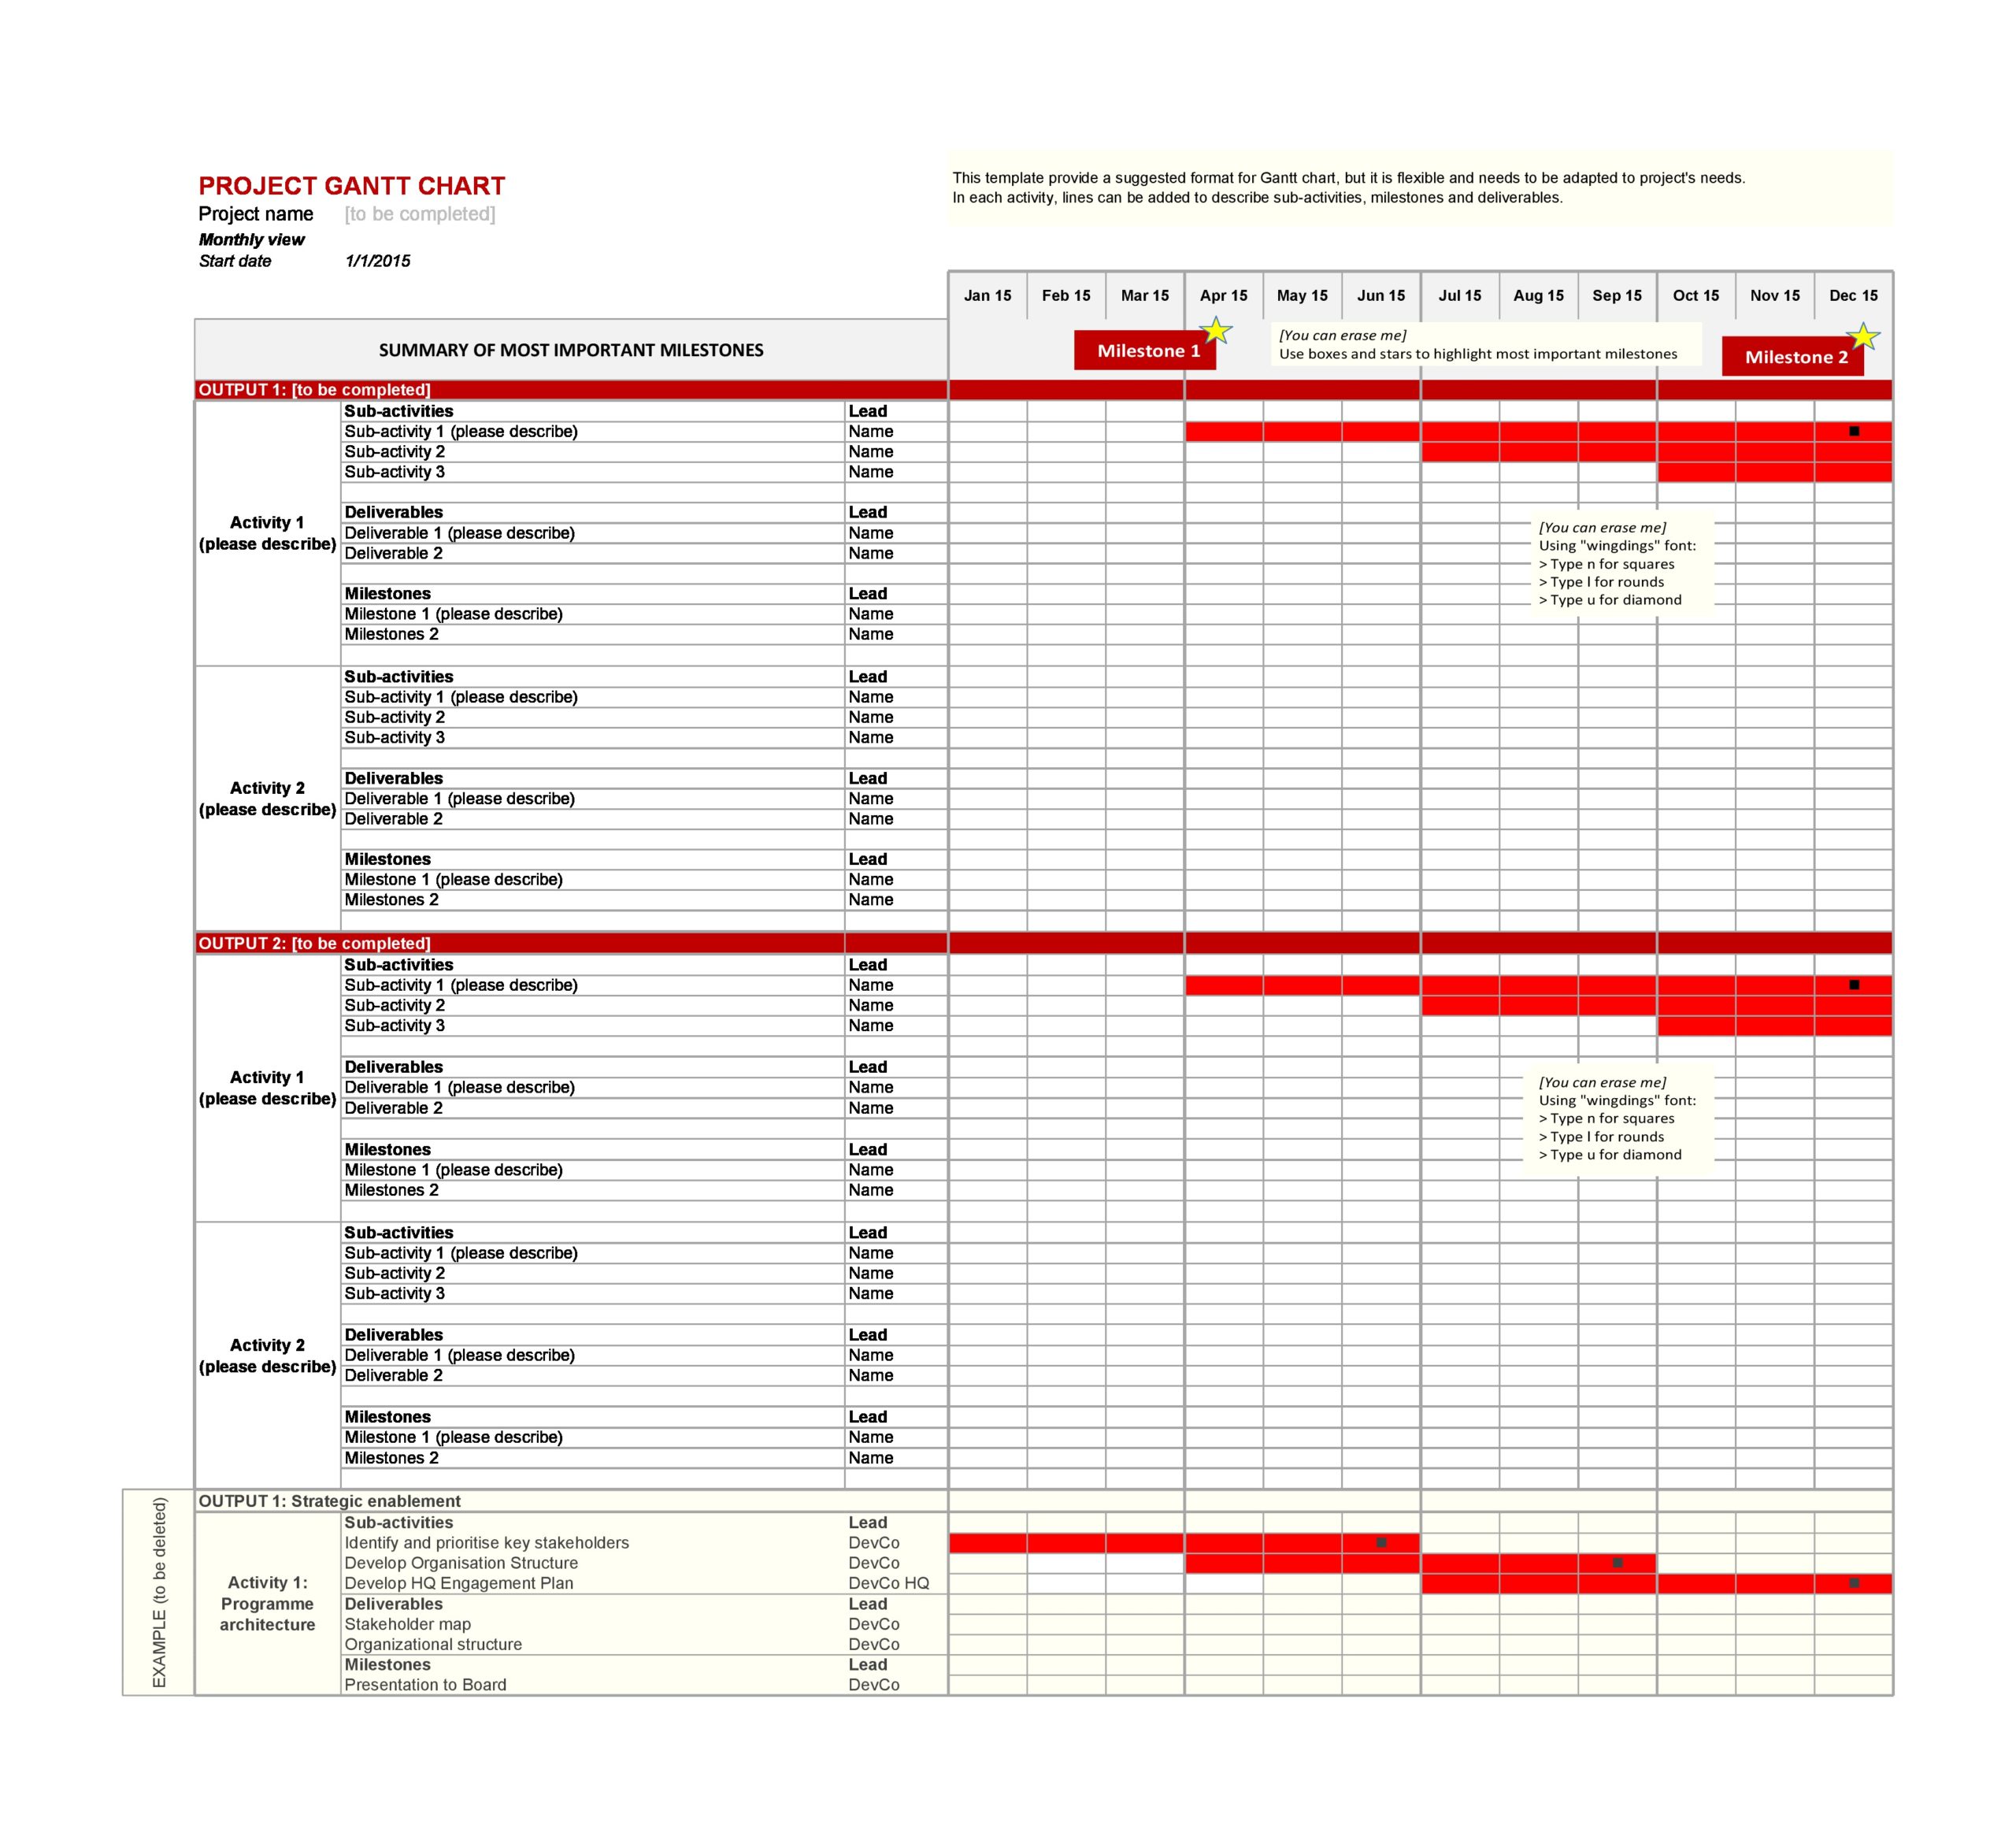
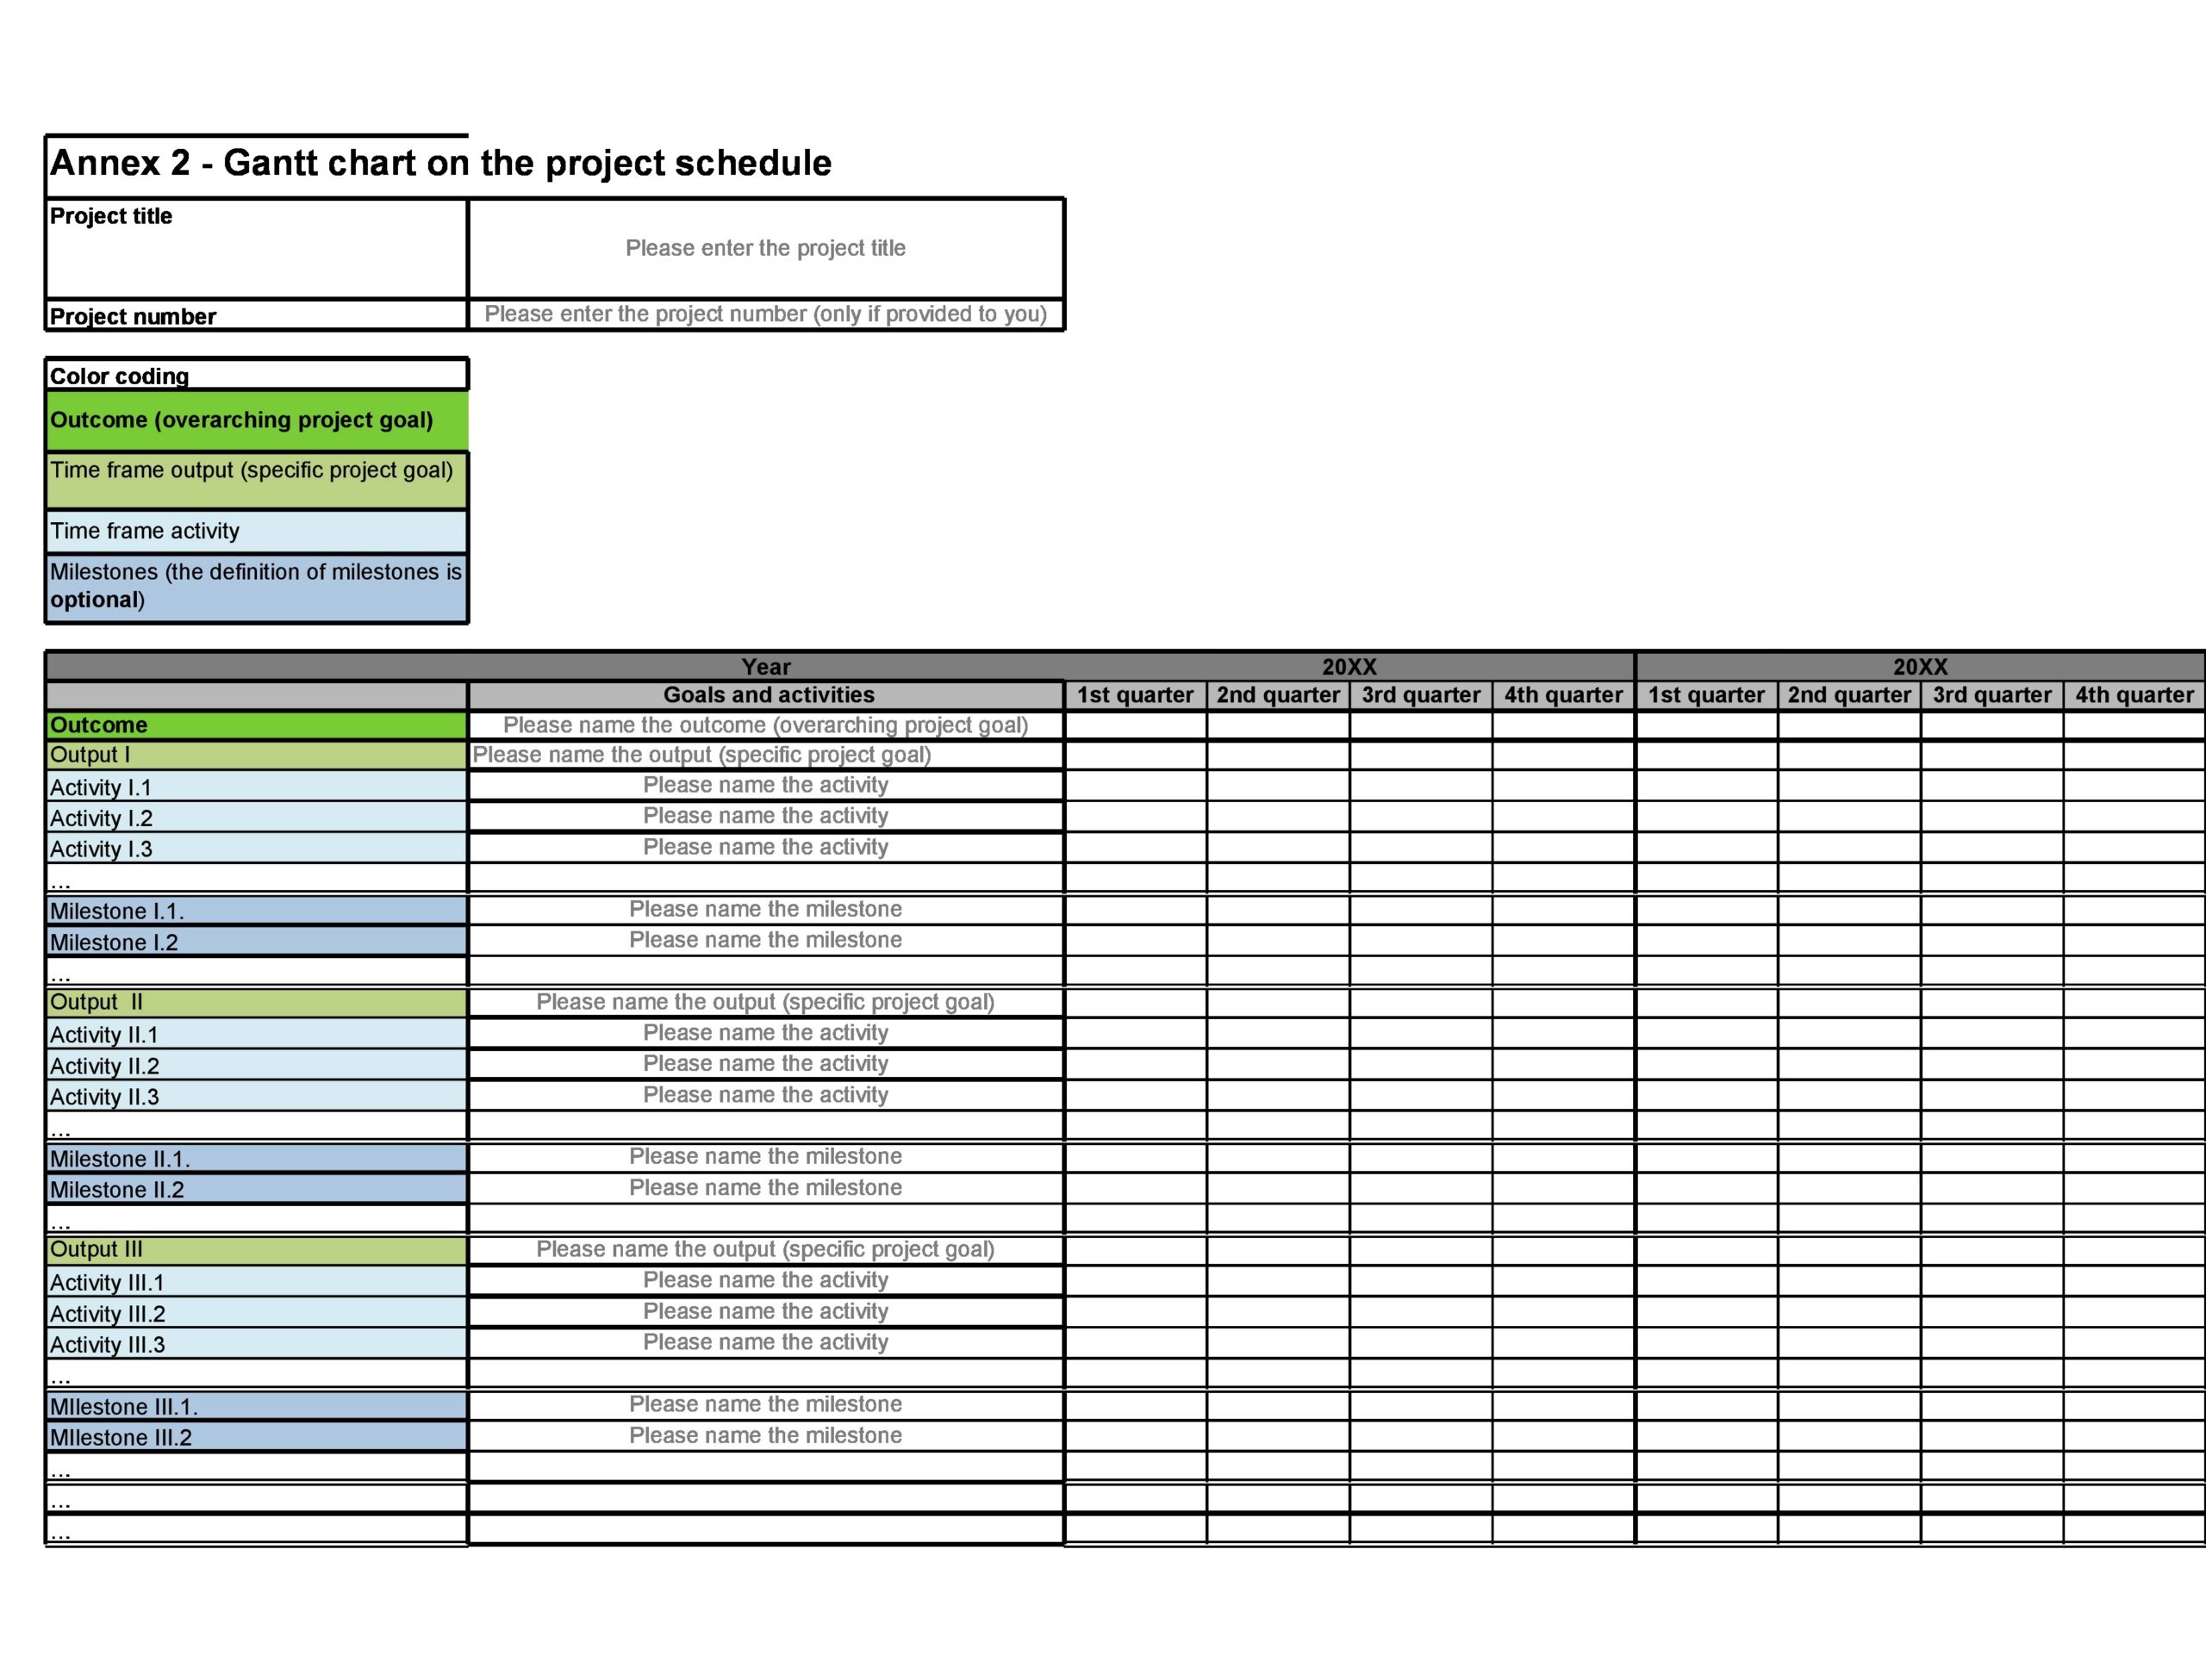
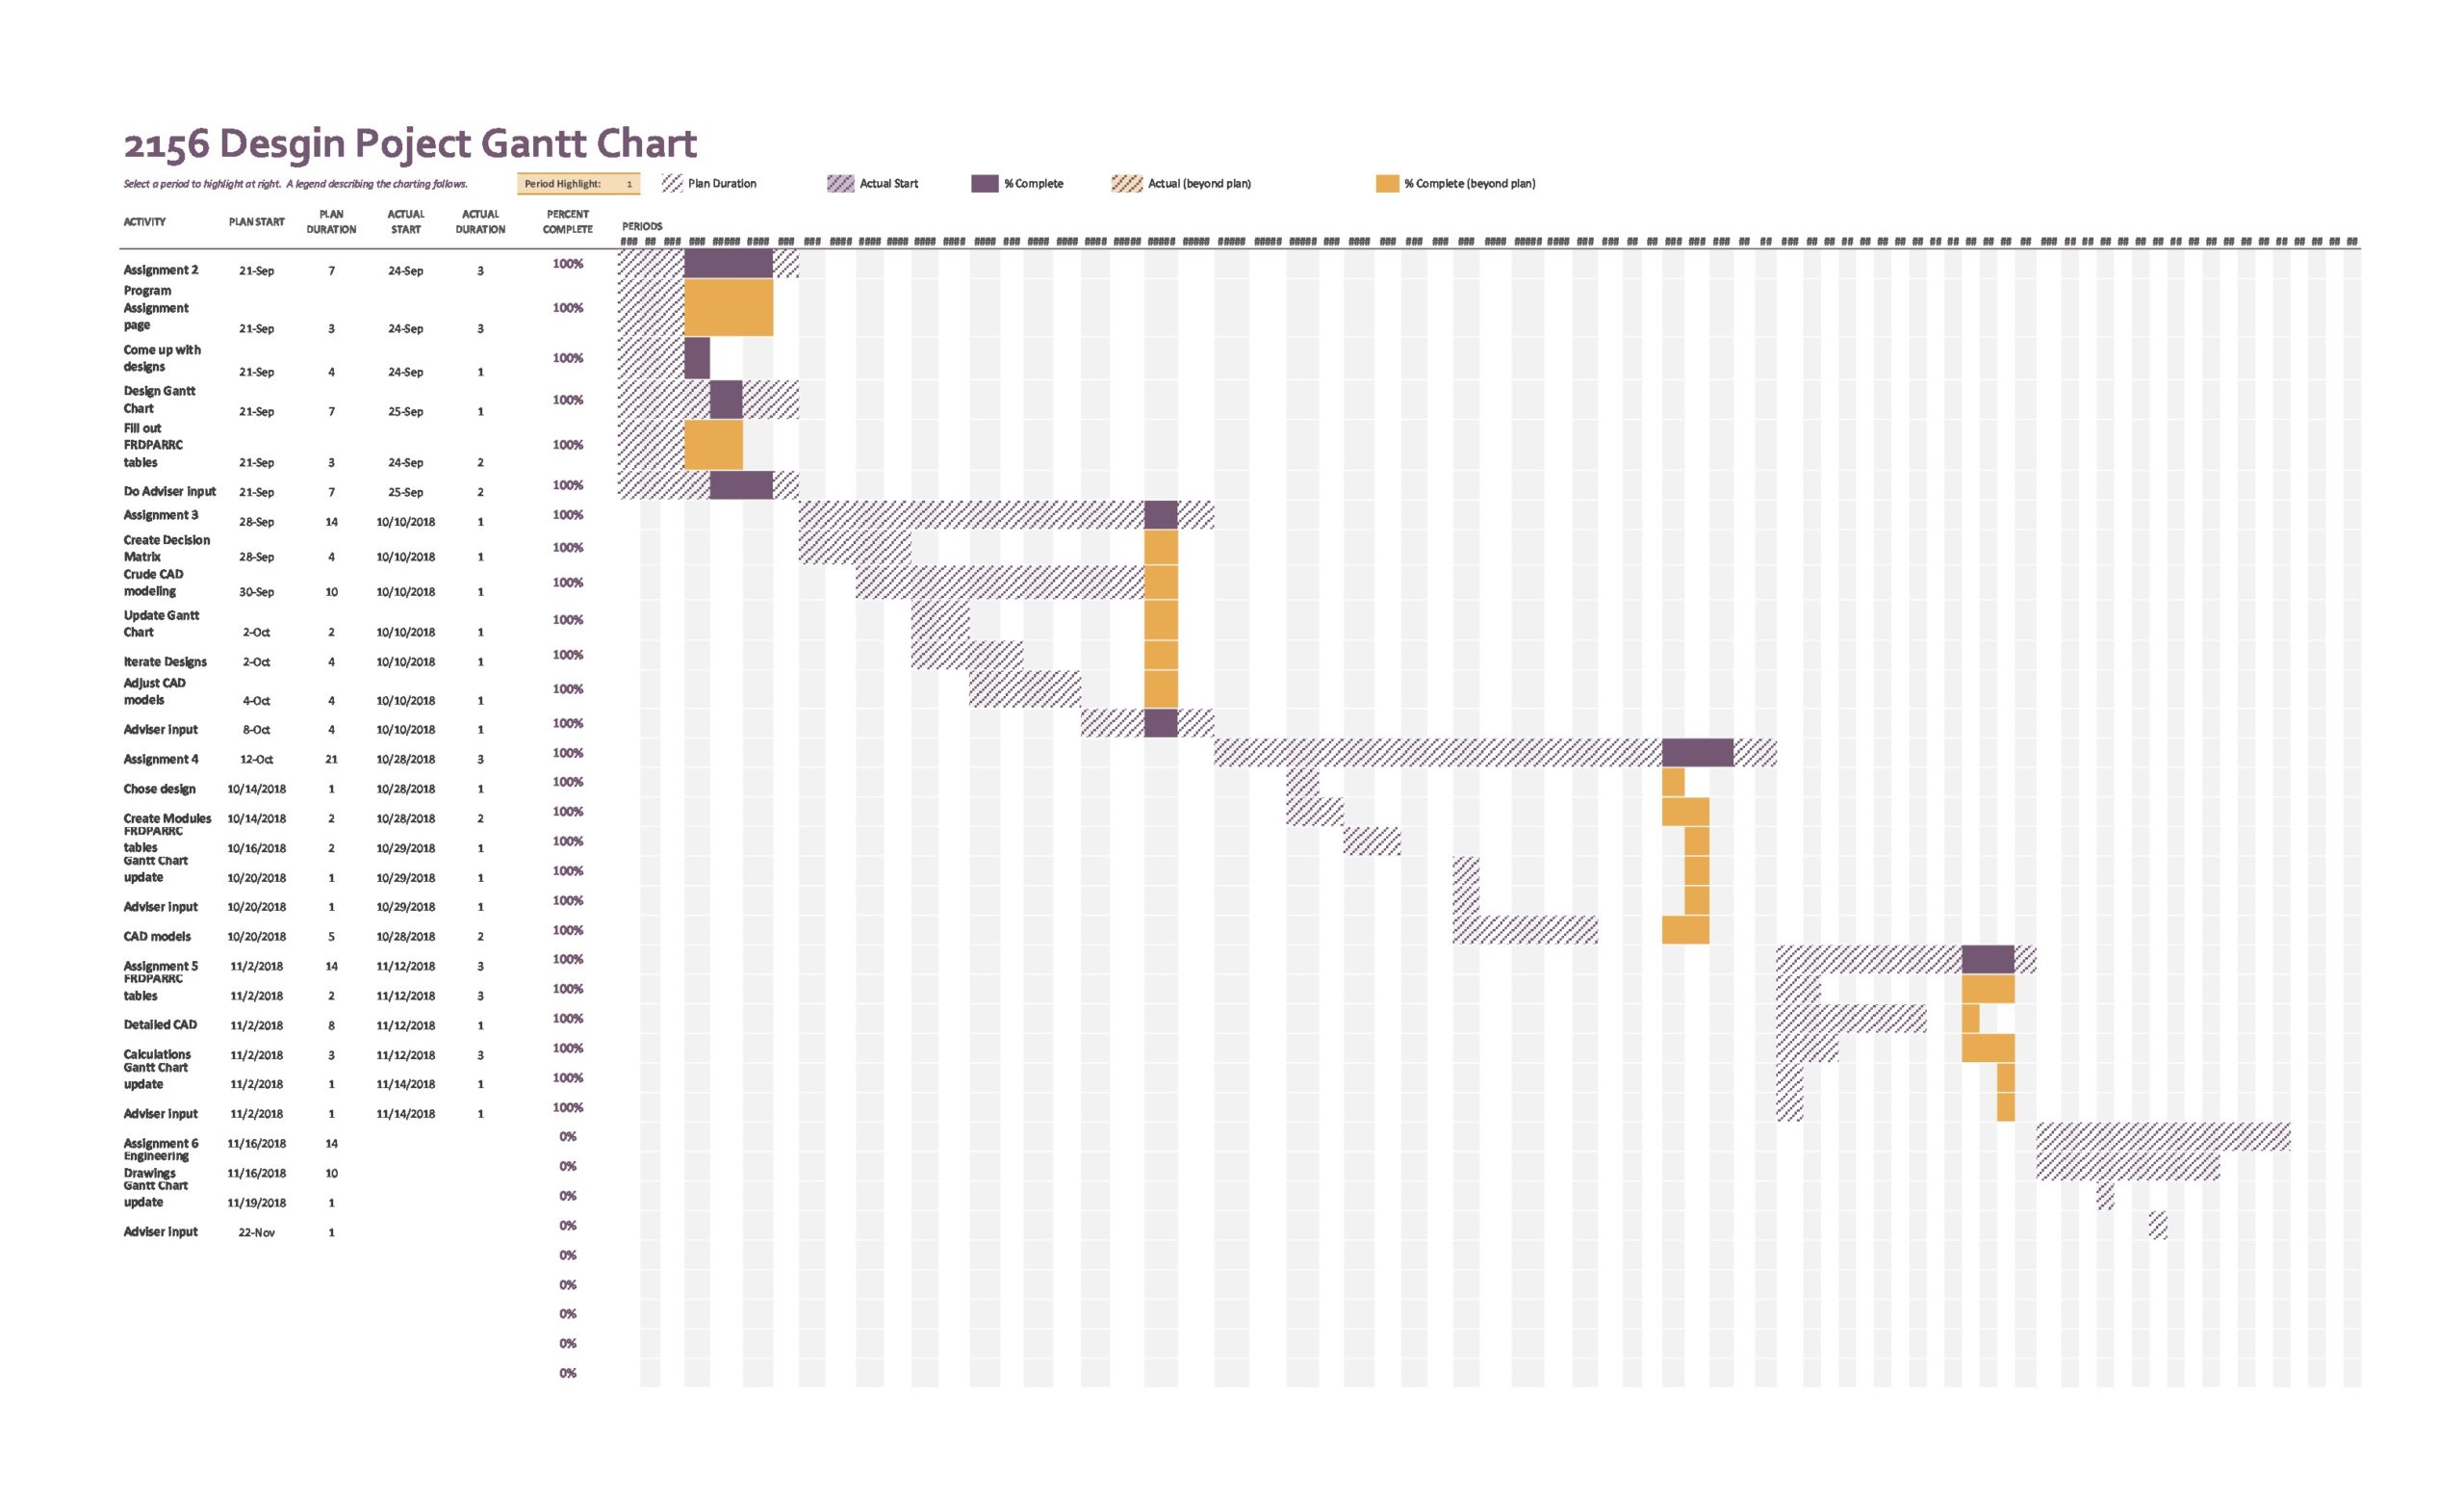
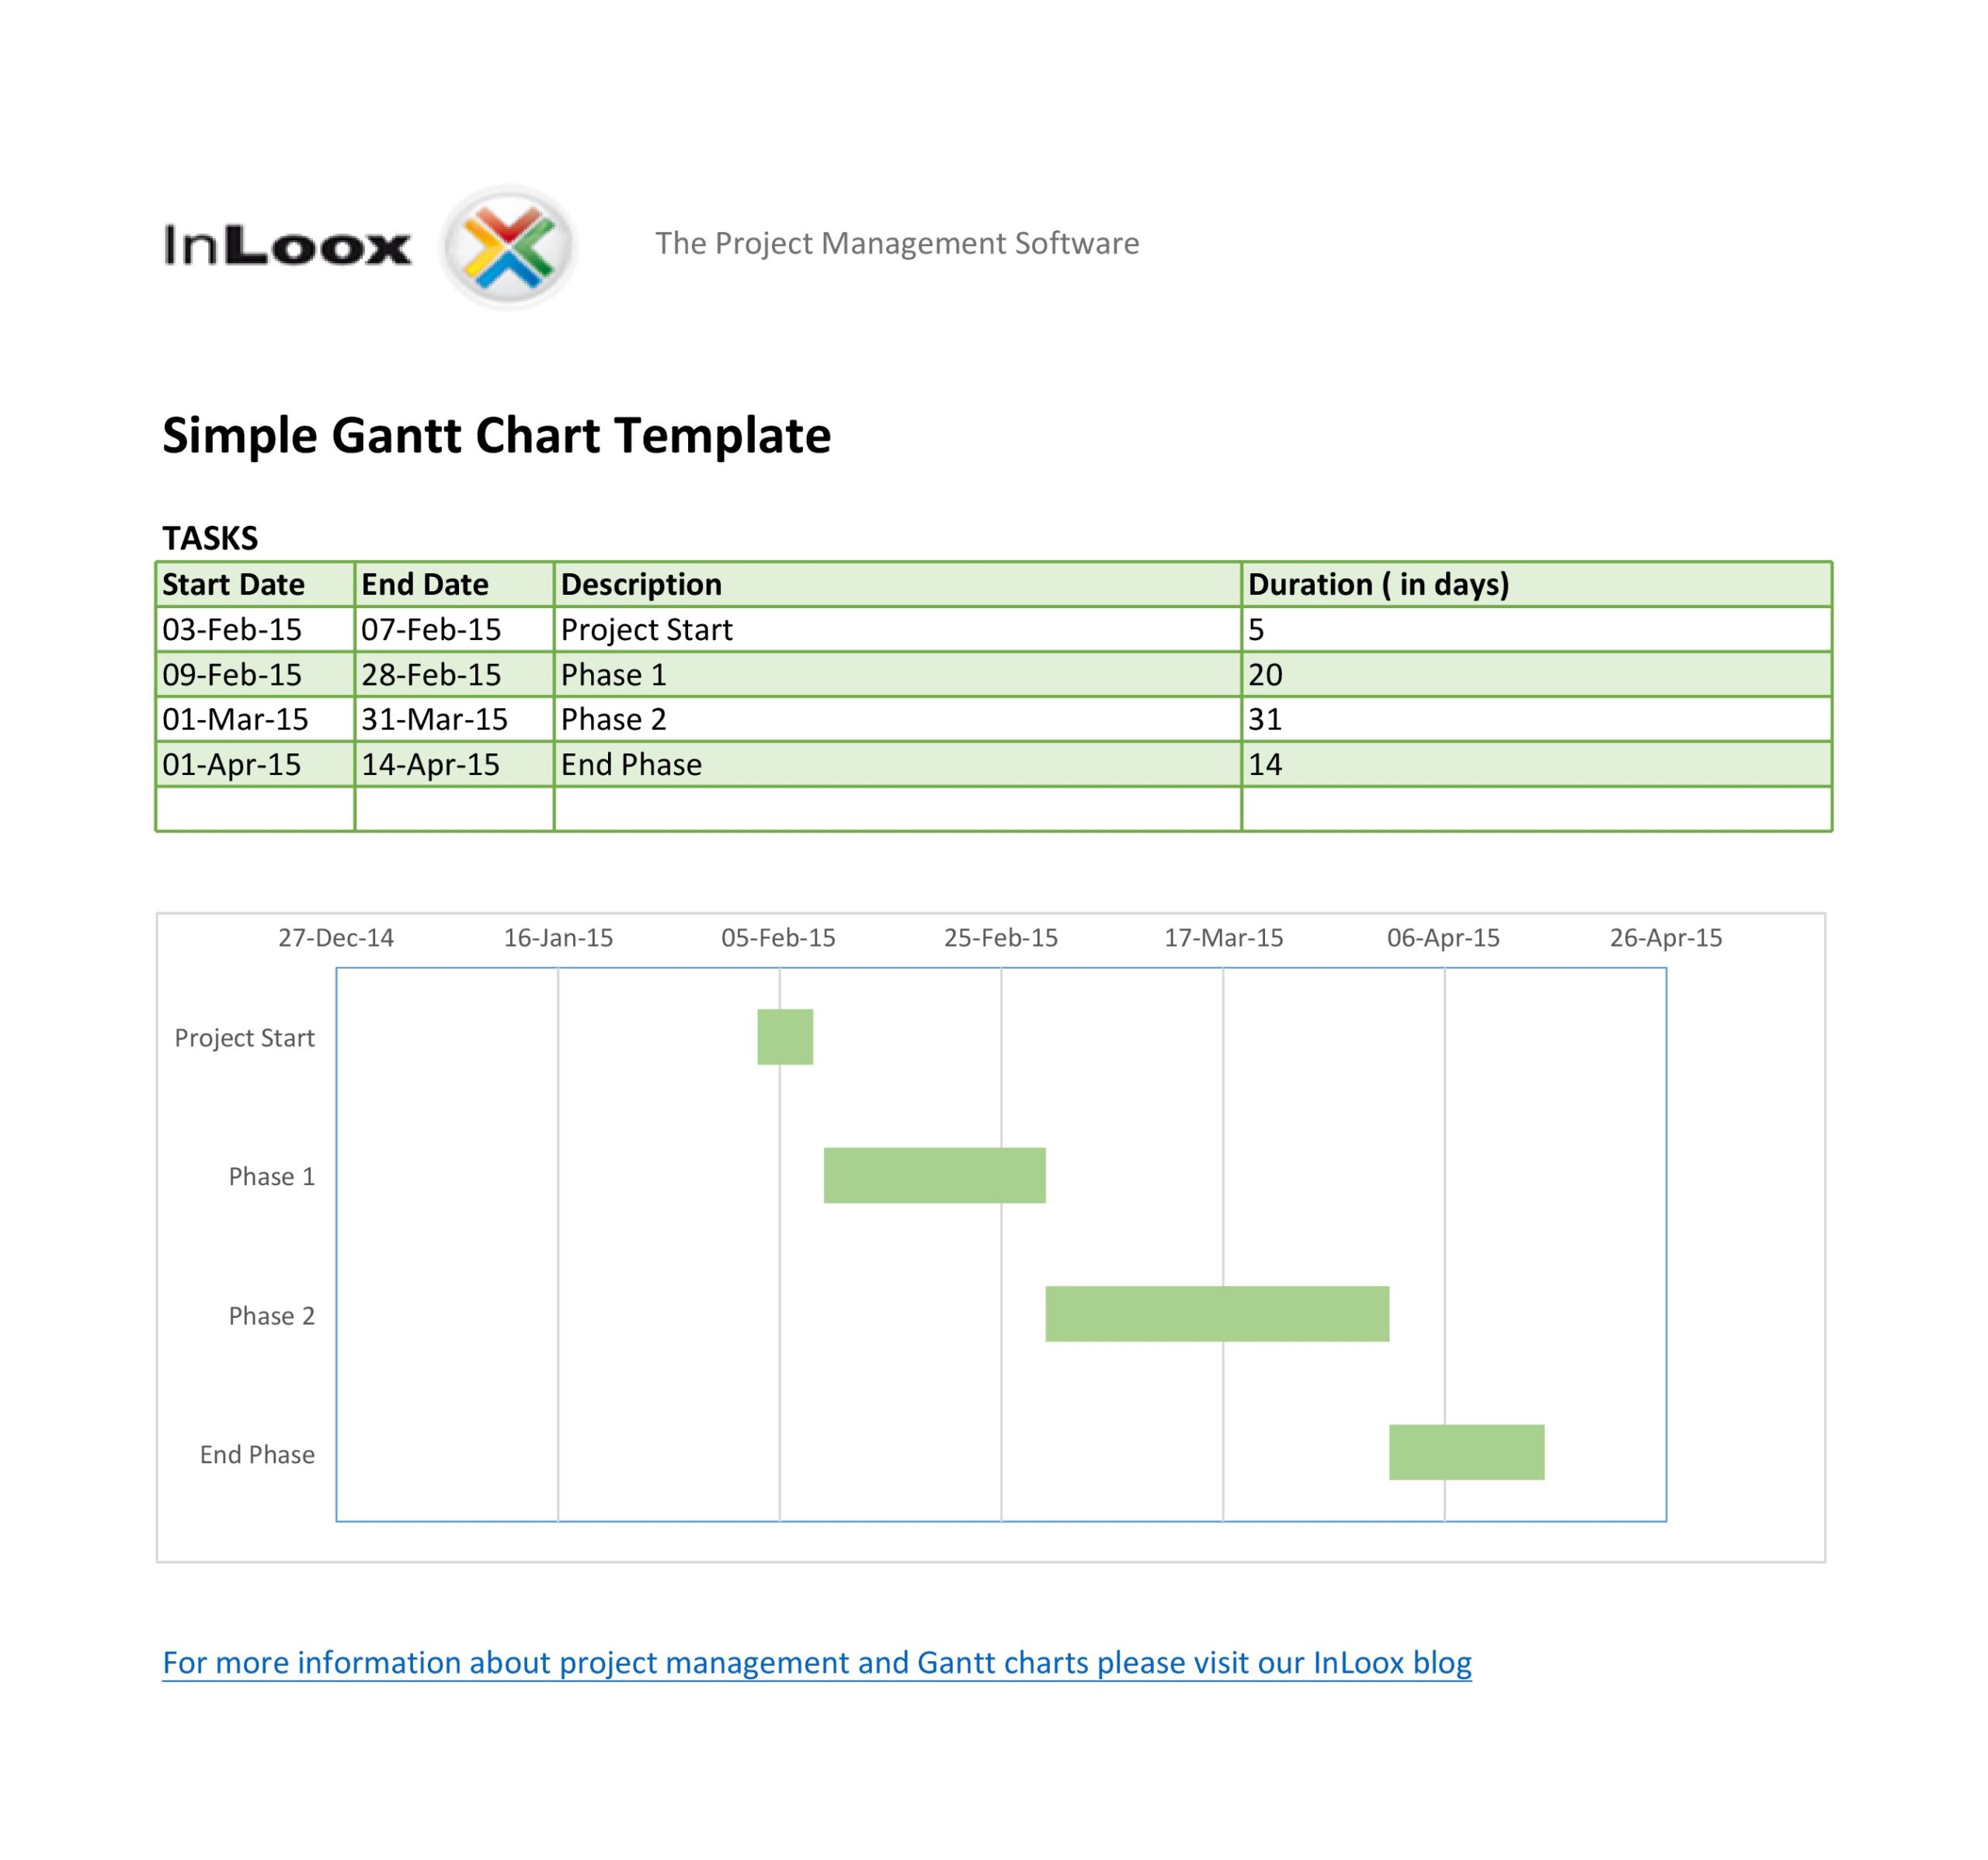
A Gantt chart is commonly used for project management and its value comes into play when planning your project. On the Gantt chart template, you would define the order of tasks which require completion. Generally, you would create your Gantt chart Excel template as a chart with horizontal bars.
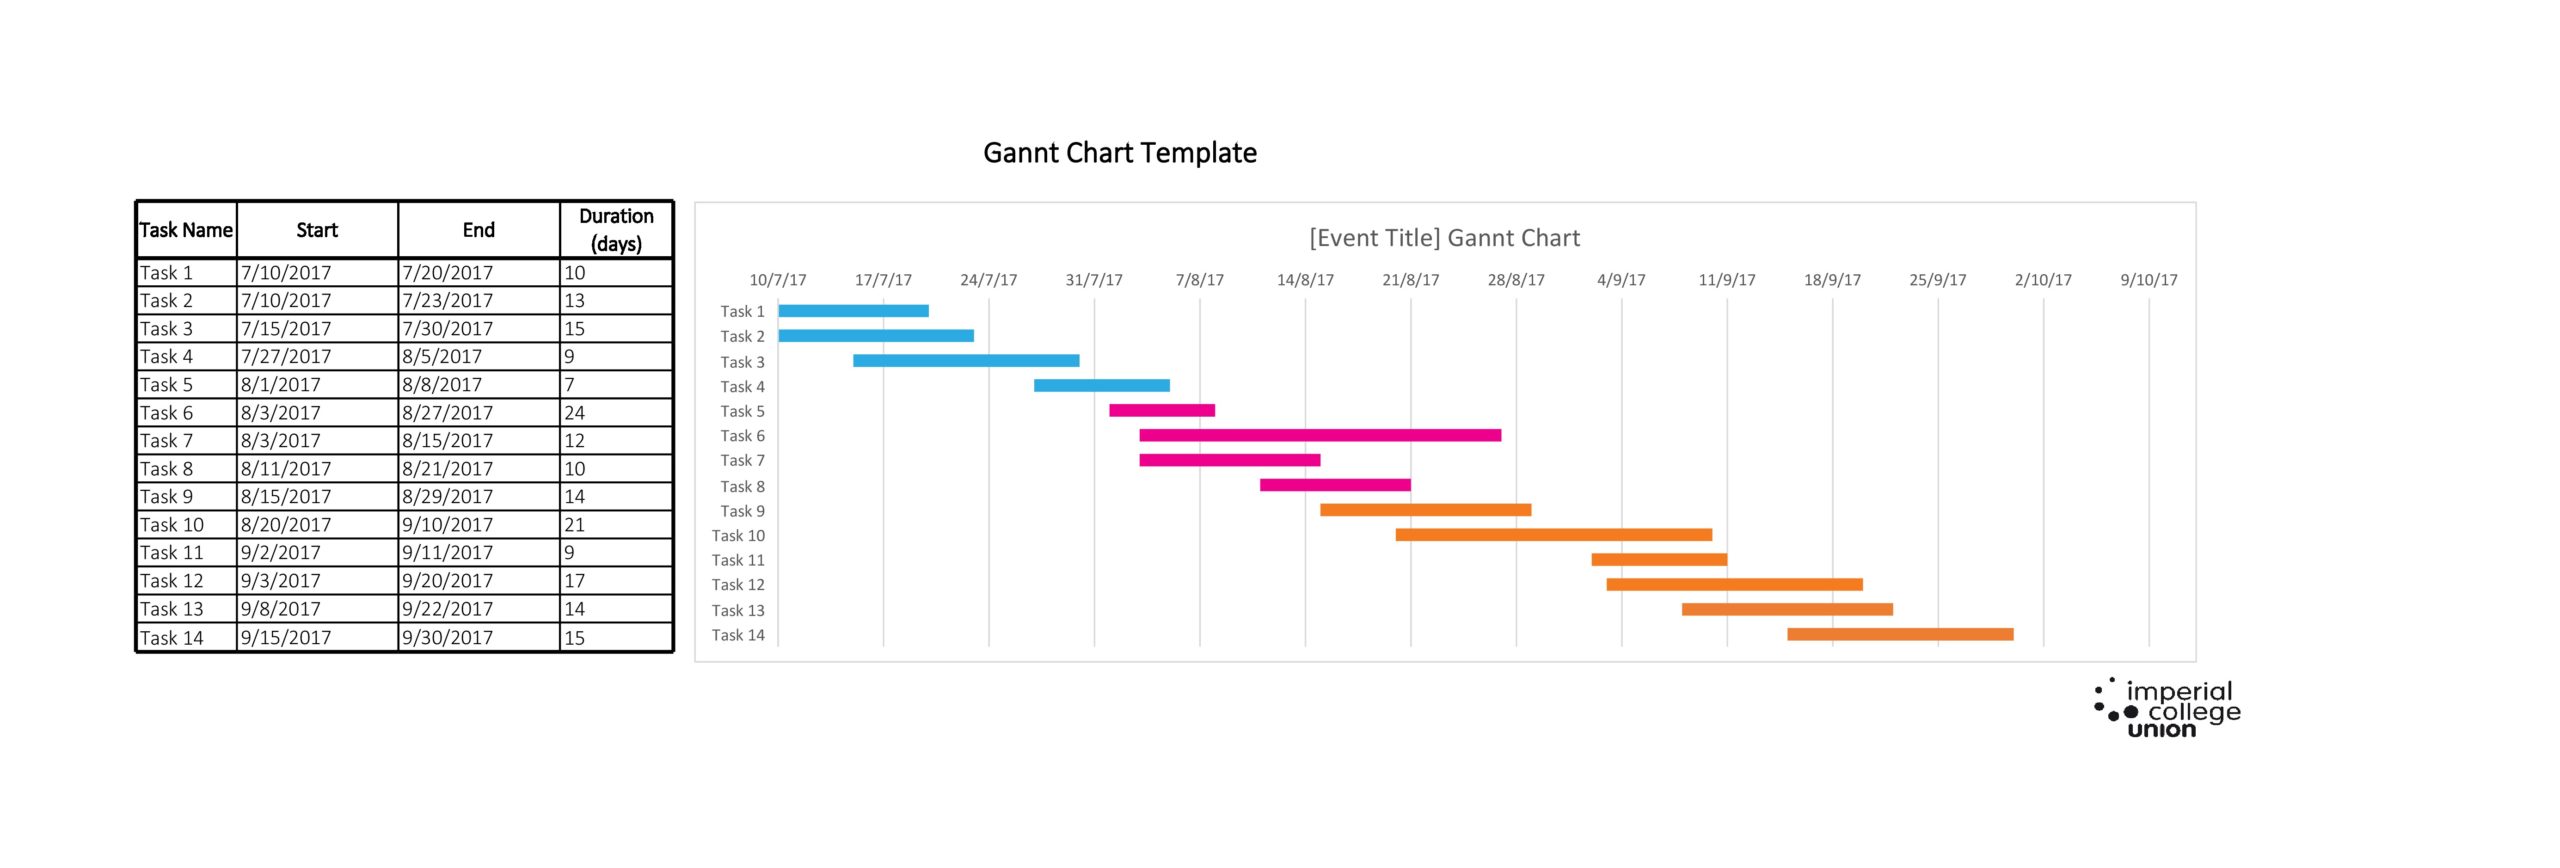
The horizontal bars you would create in a Gantt chart Excel are of varying lengths, but they still represent the timelines of the project. This includes the sequencing of tasks, their duration, and the beginning and completion dates of each of the tasks. The same horizontal bars also provide information on how much of each task would require completion.
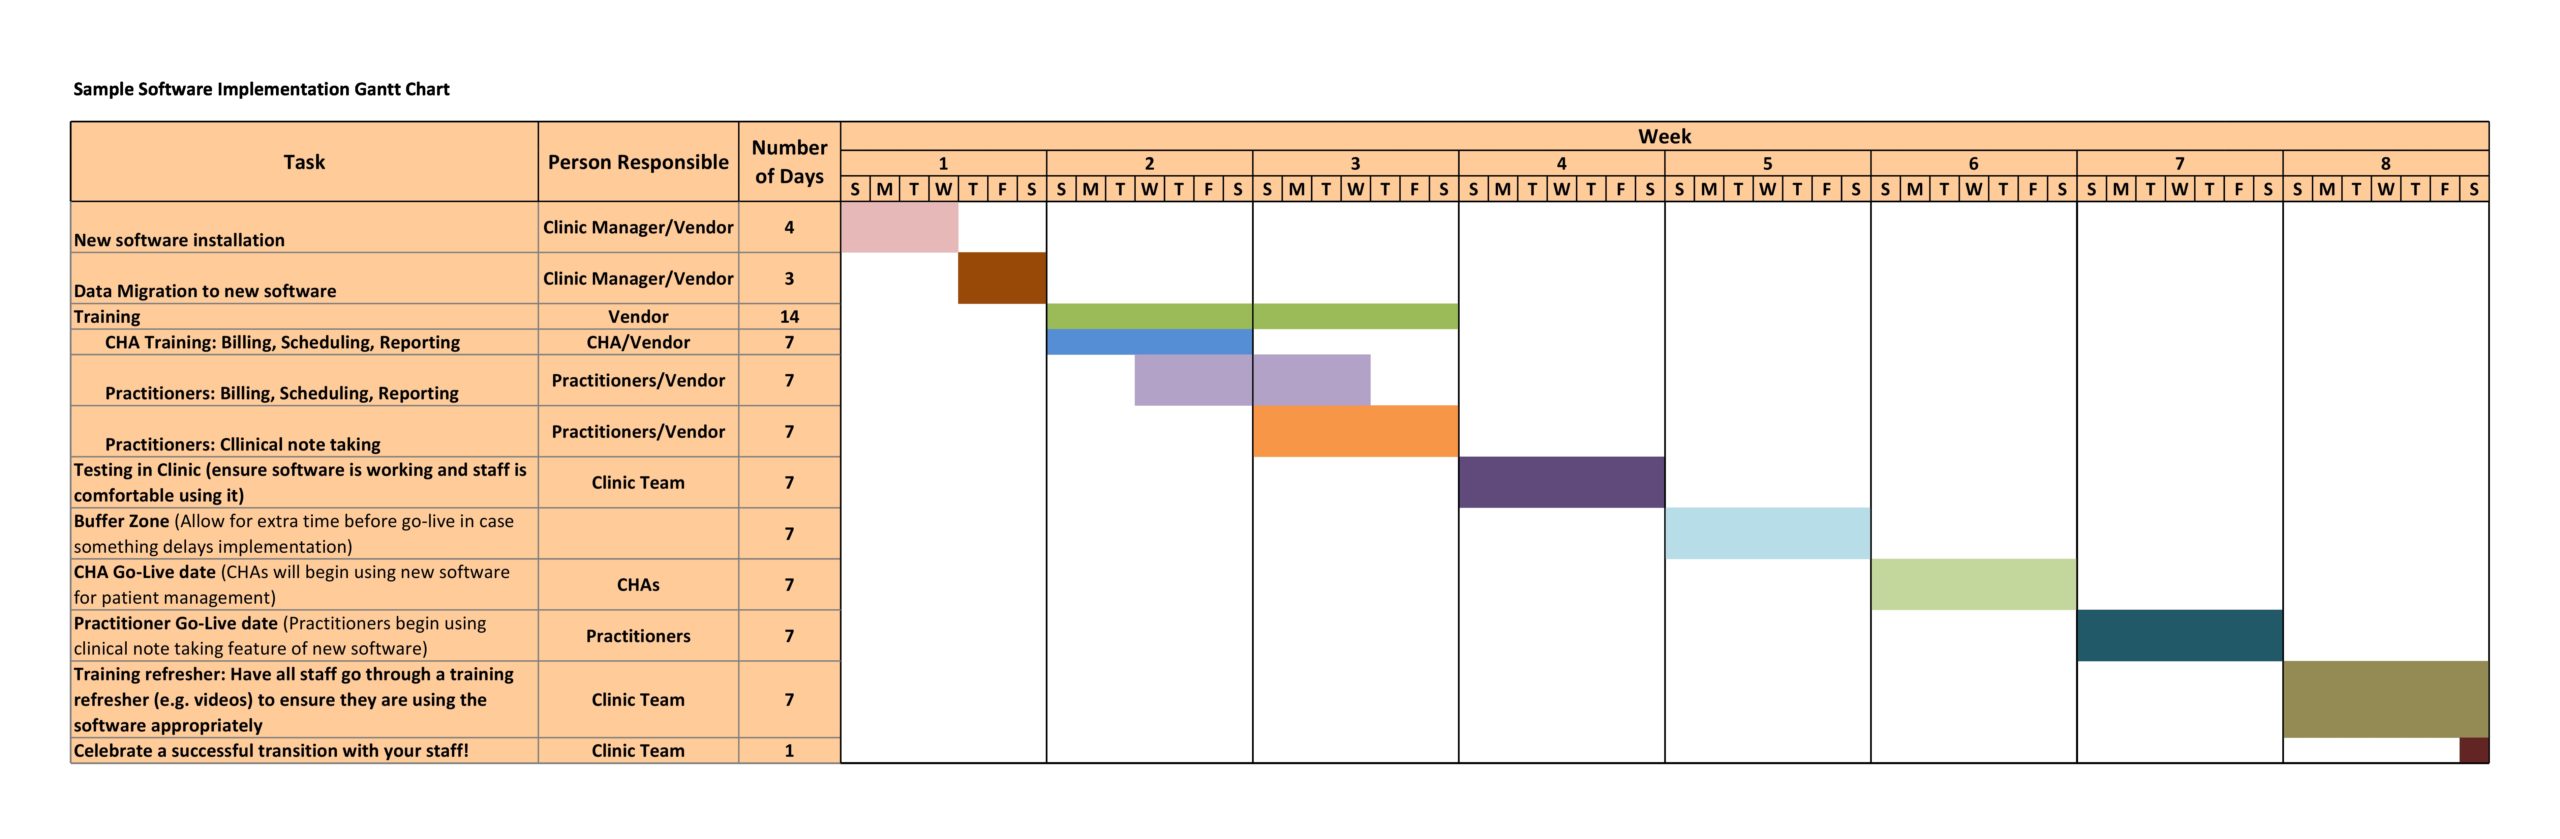
The chart is primarily made for managing, monitoring, and scheduling specific resources and tasks of a project. The timeline feature includes completed and scheduled works over a defined period. This is an important tool for project managers, especially in communicating the current status of the project or plans.
The advantage of using a Gantt chart
Here are some advantages of having a Gantt Chart for each project:
- Using a free Gantt chart template can help you identify which projects you can execute in parallel, as well as those which you cannot start or finish until the completion of other tasks.
- You can use it to predict potential bottlenecks.
- With a Gantt chart template, you can easily identify tasks which might have gotten excluded from the timeline of the project.
- With the chart, you can allot more time for tasks that you need to complete should there be a delay in the project. You can delay activities that are non-critical, but you must execute the critical ones as scheduled.
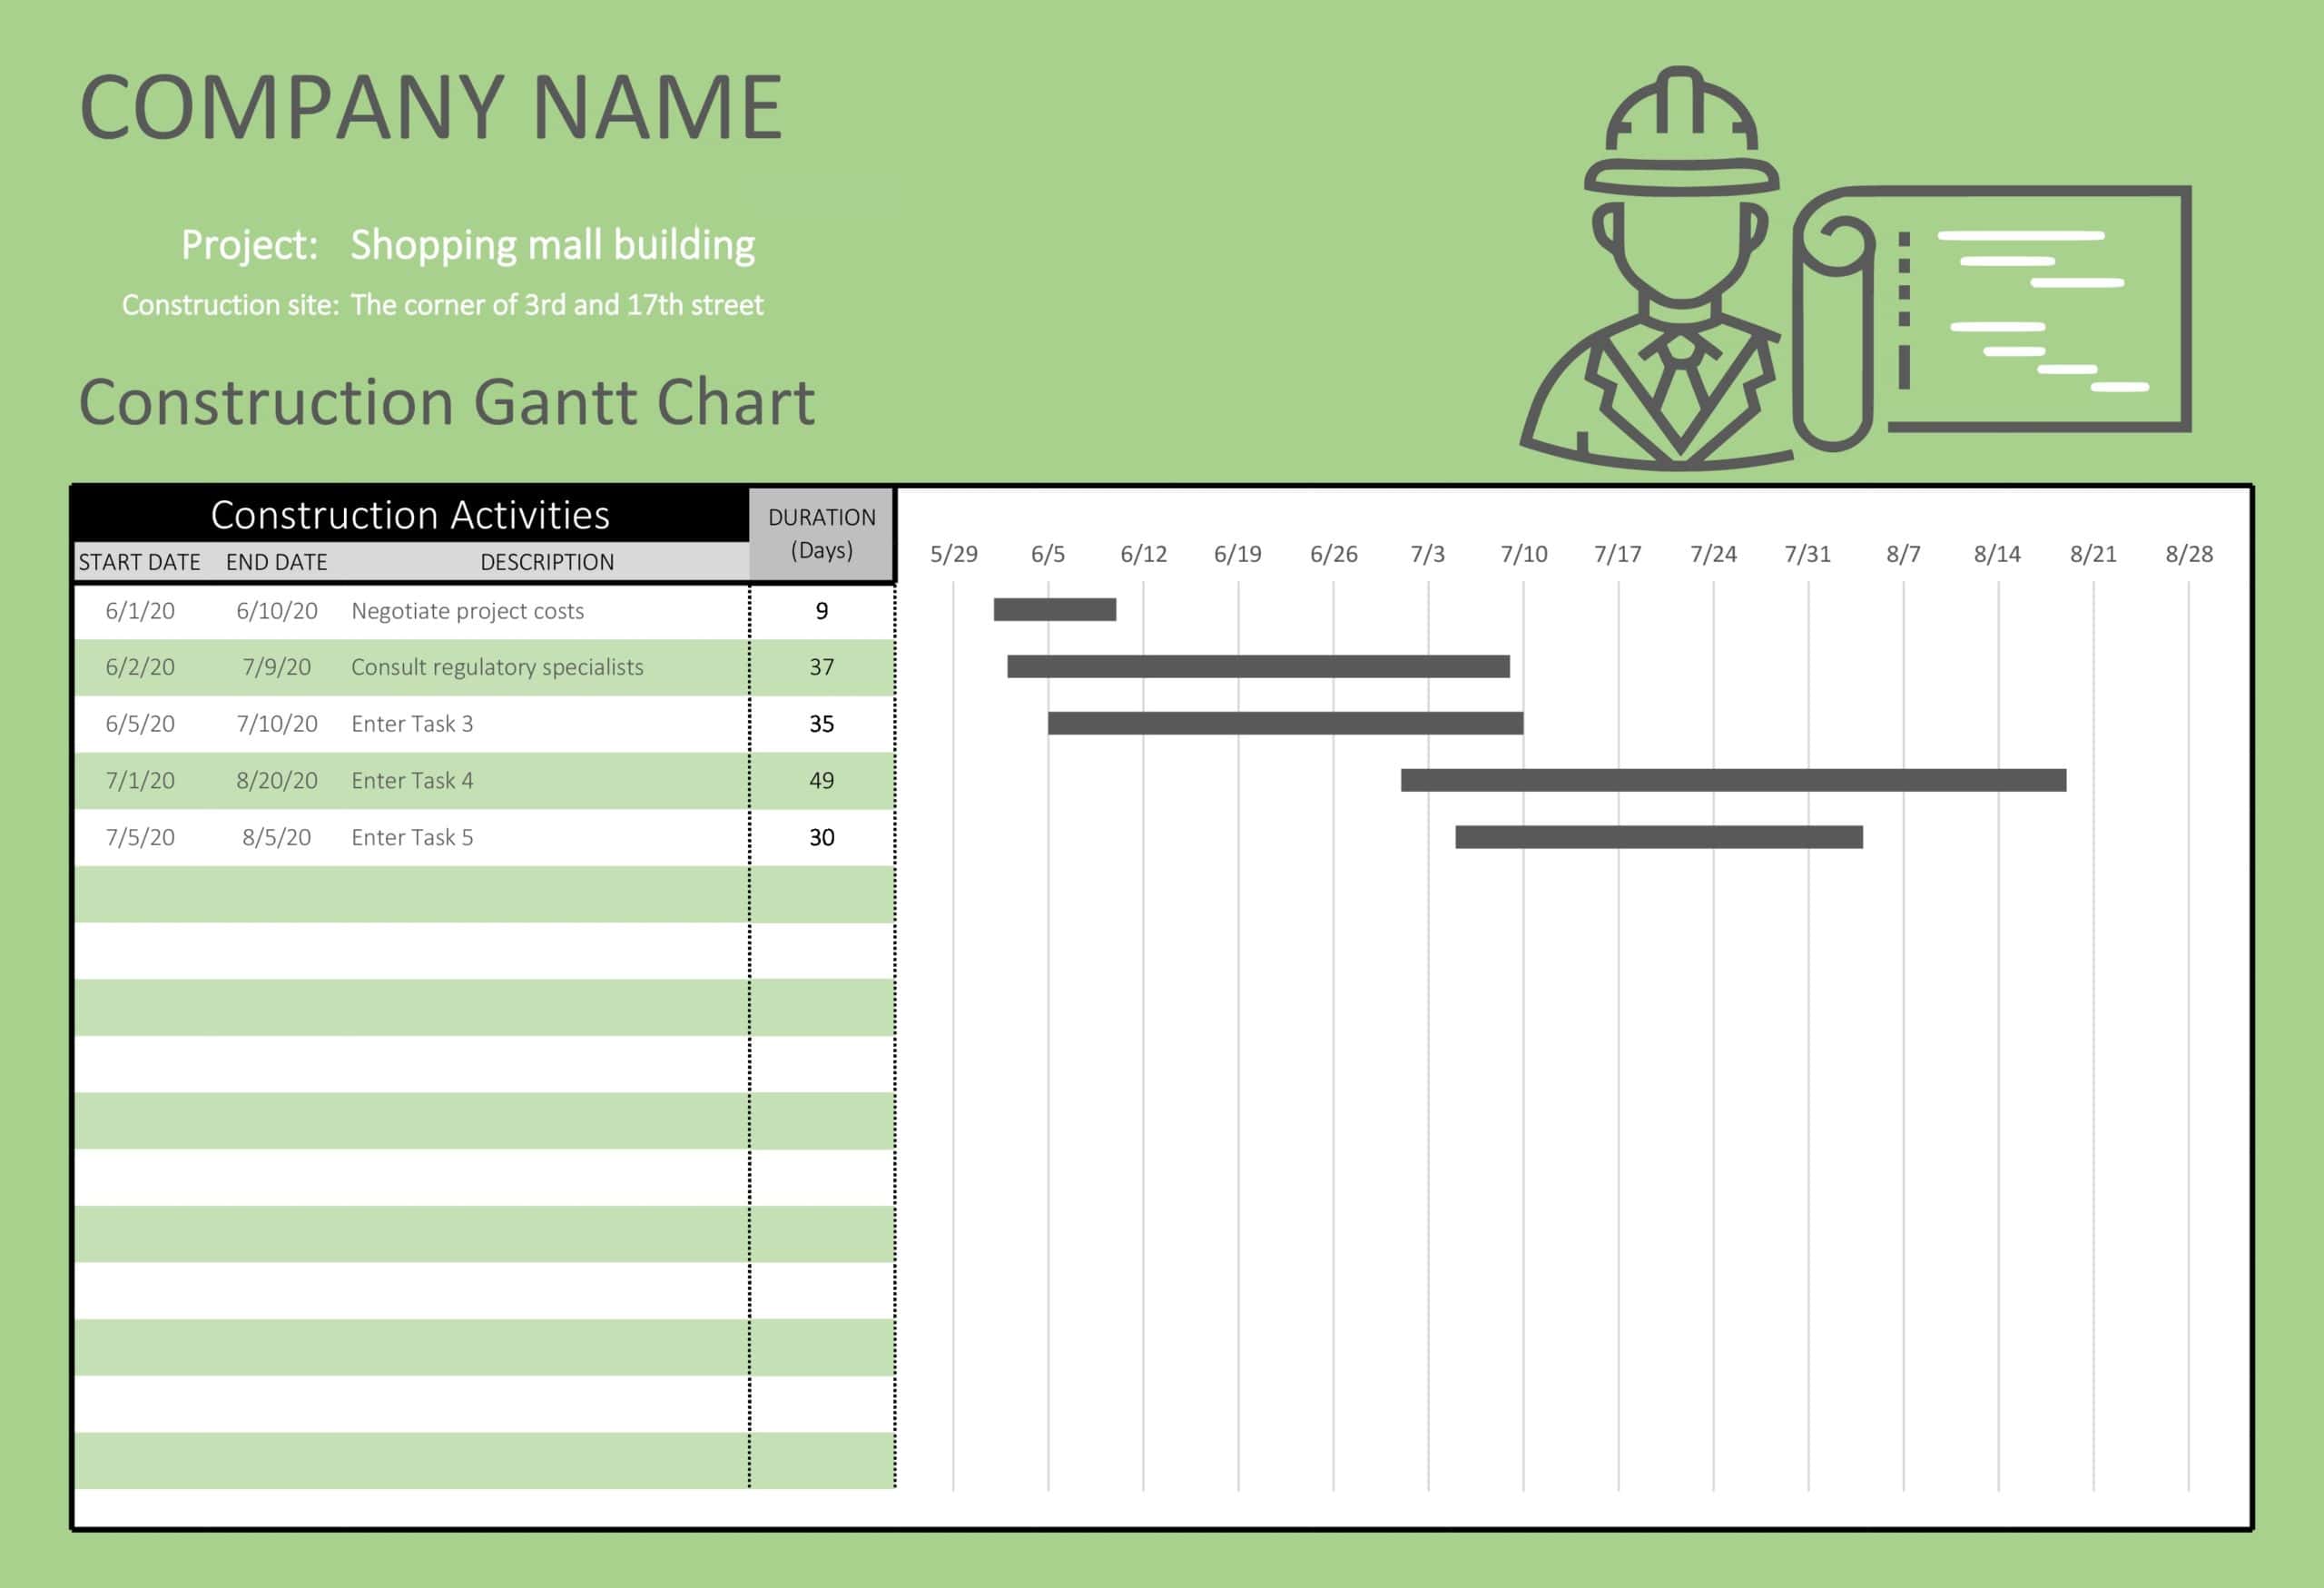
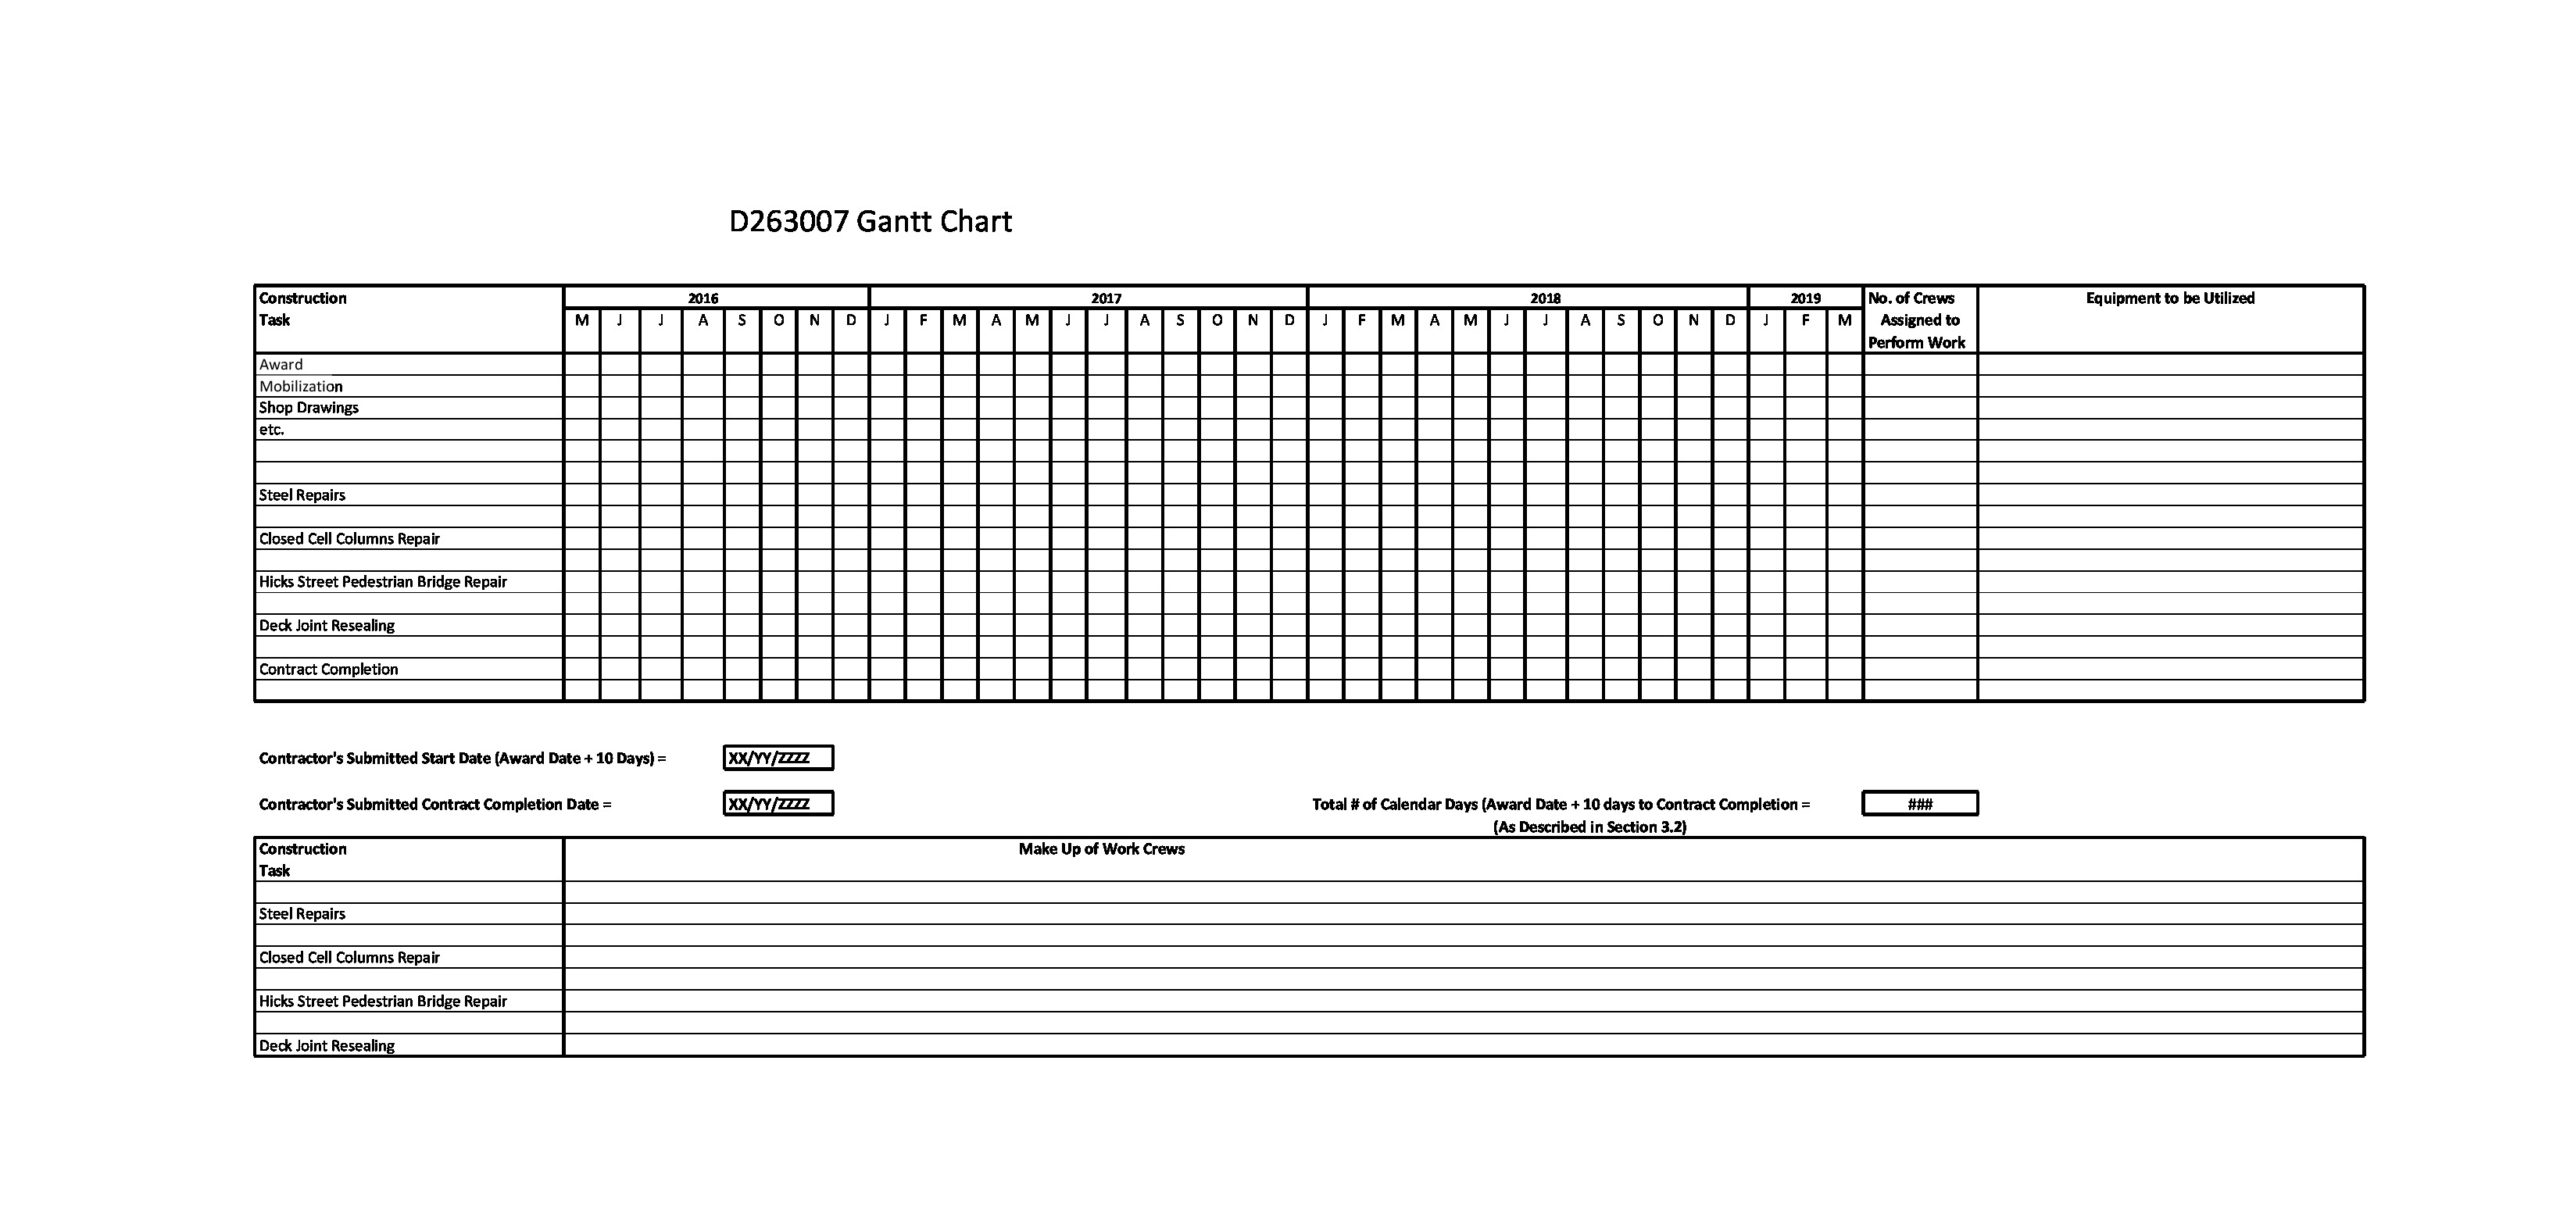
You can use a Gantt chart Excel template in the management of projects, regardless of their types and sizes. They are commonly used in many industries and for different kinds of projects like the building of dams, highways, and bridges, development of software, and the development of products and services in the business world.
Presently, there are various software applications you can use for designing a Gantt chart Excel. Use these project management tools to make it easier for you to create your chart.
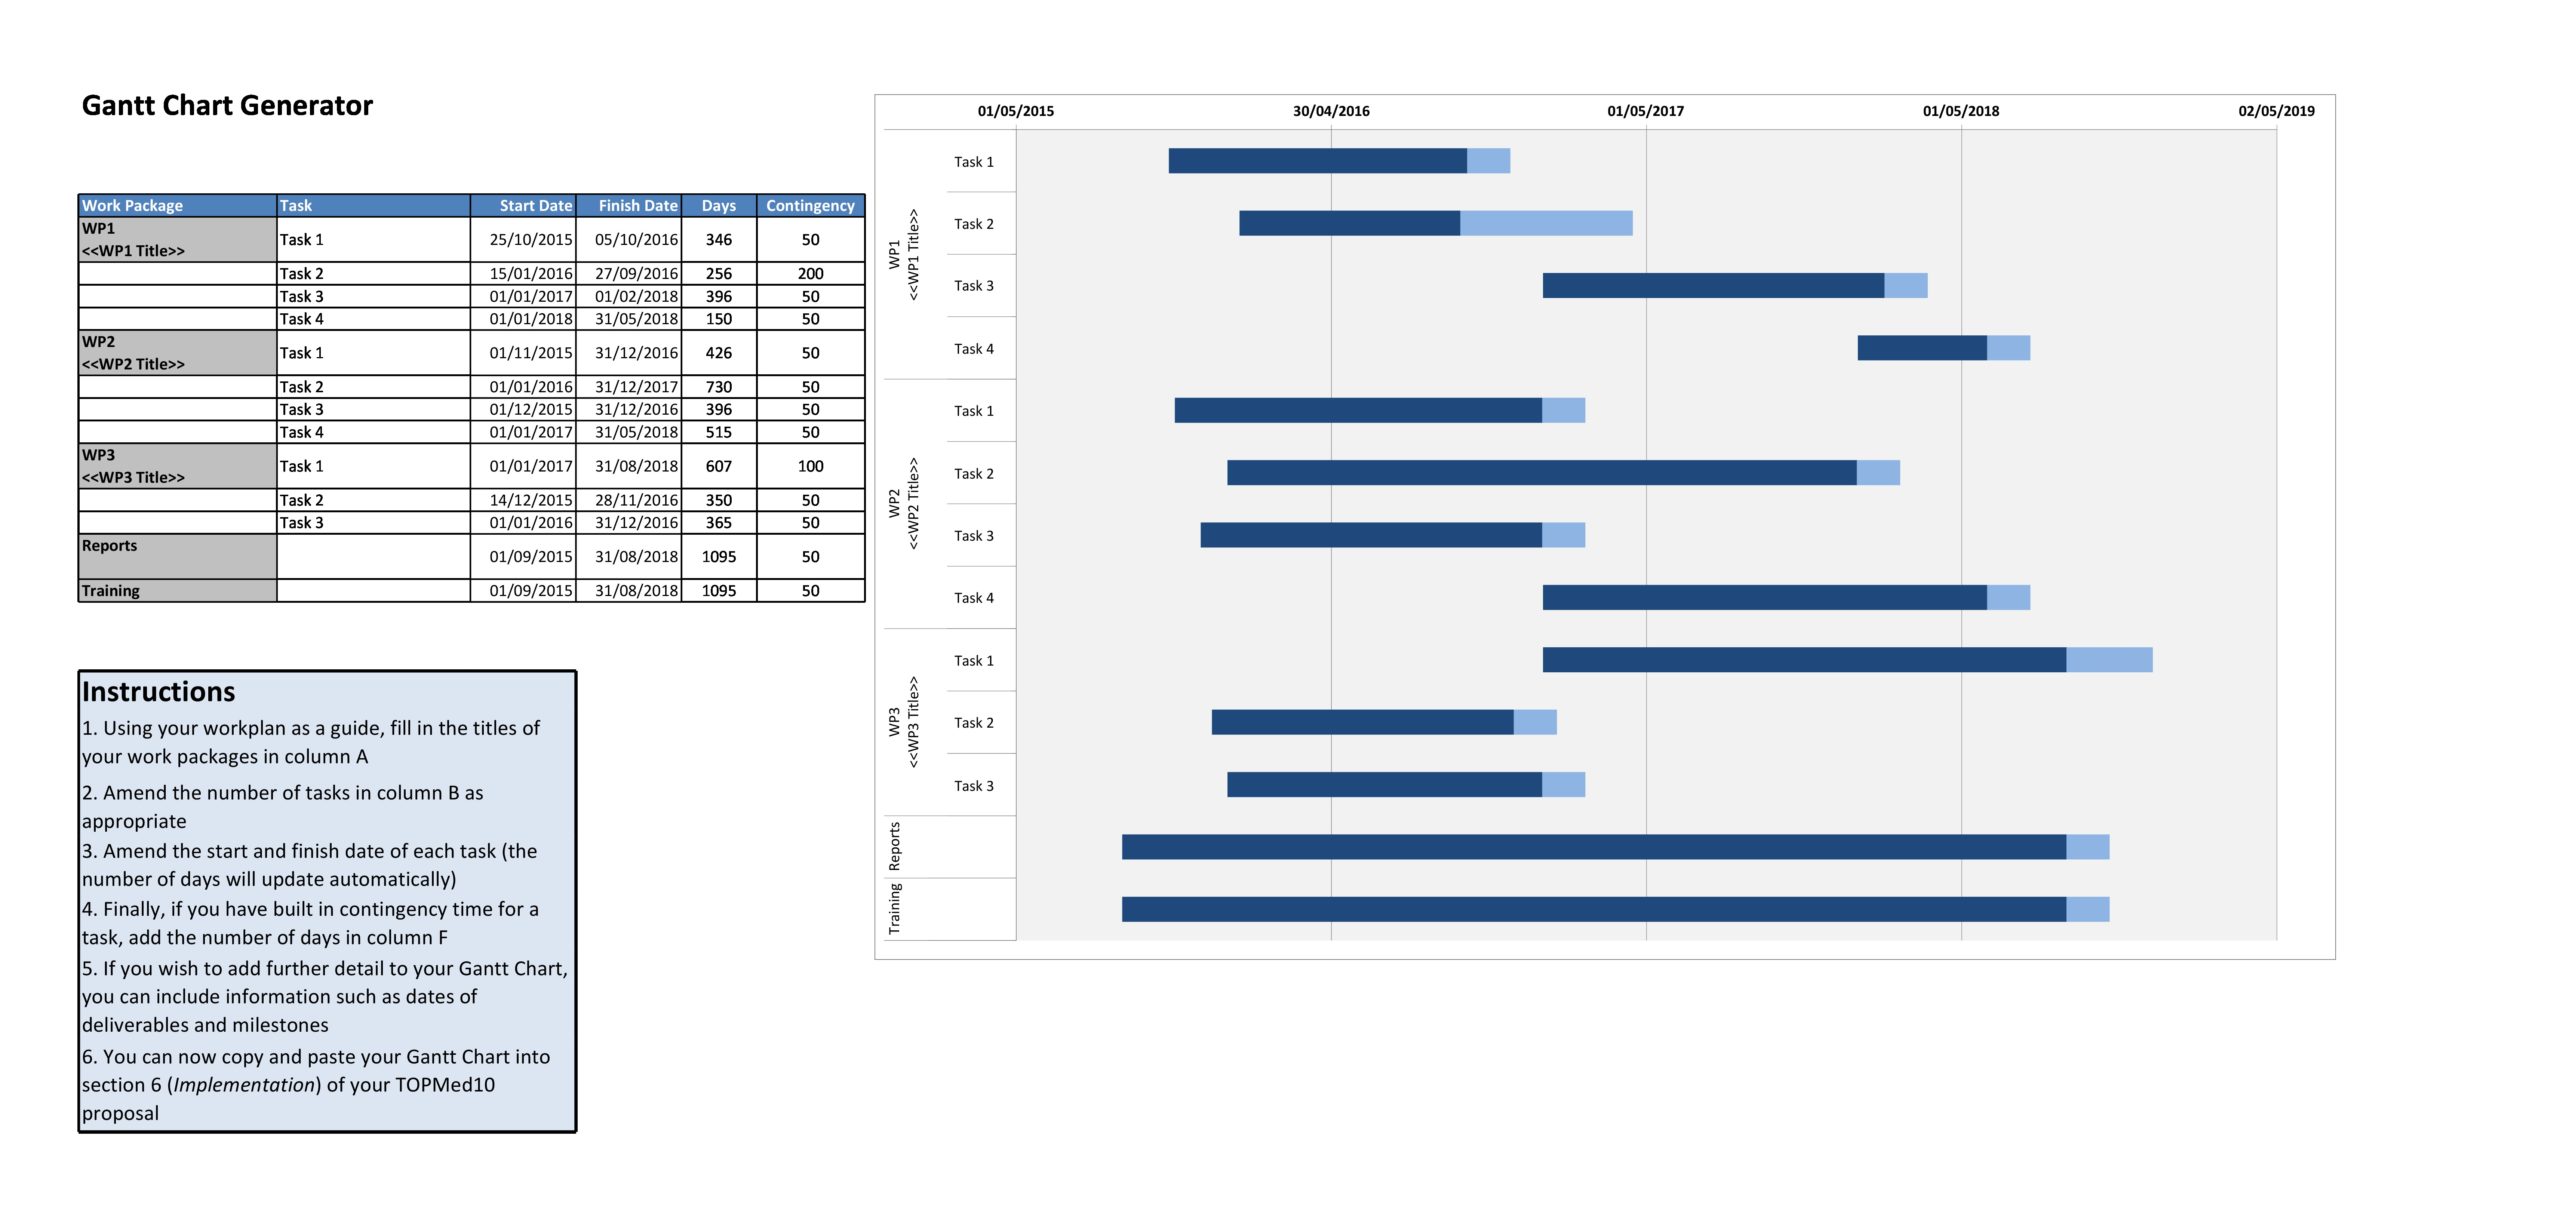
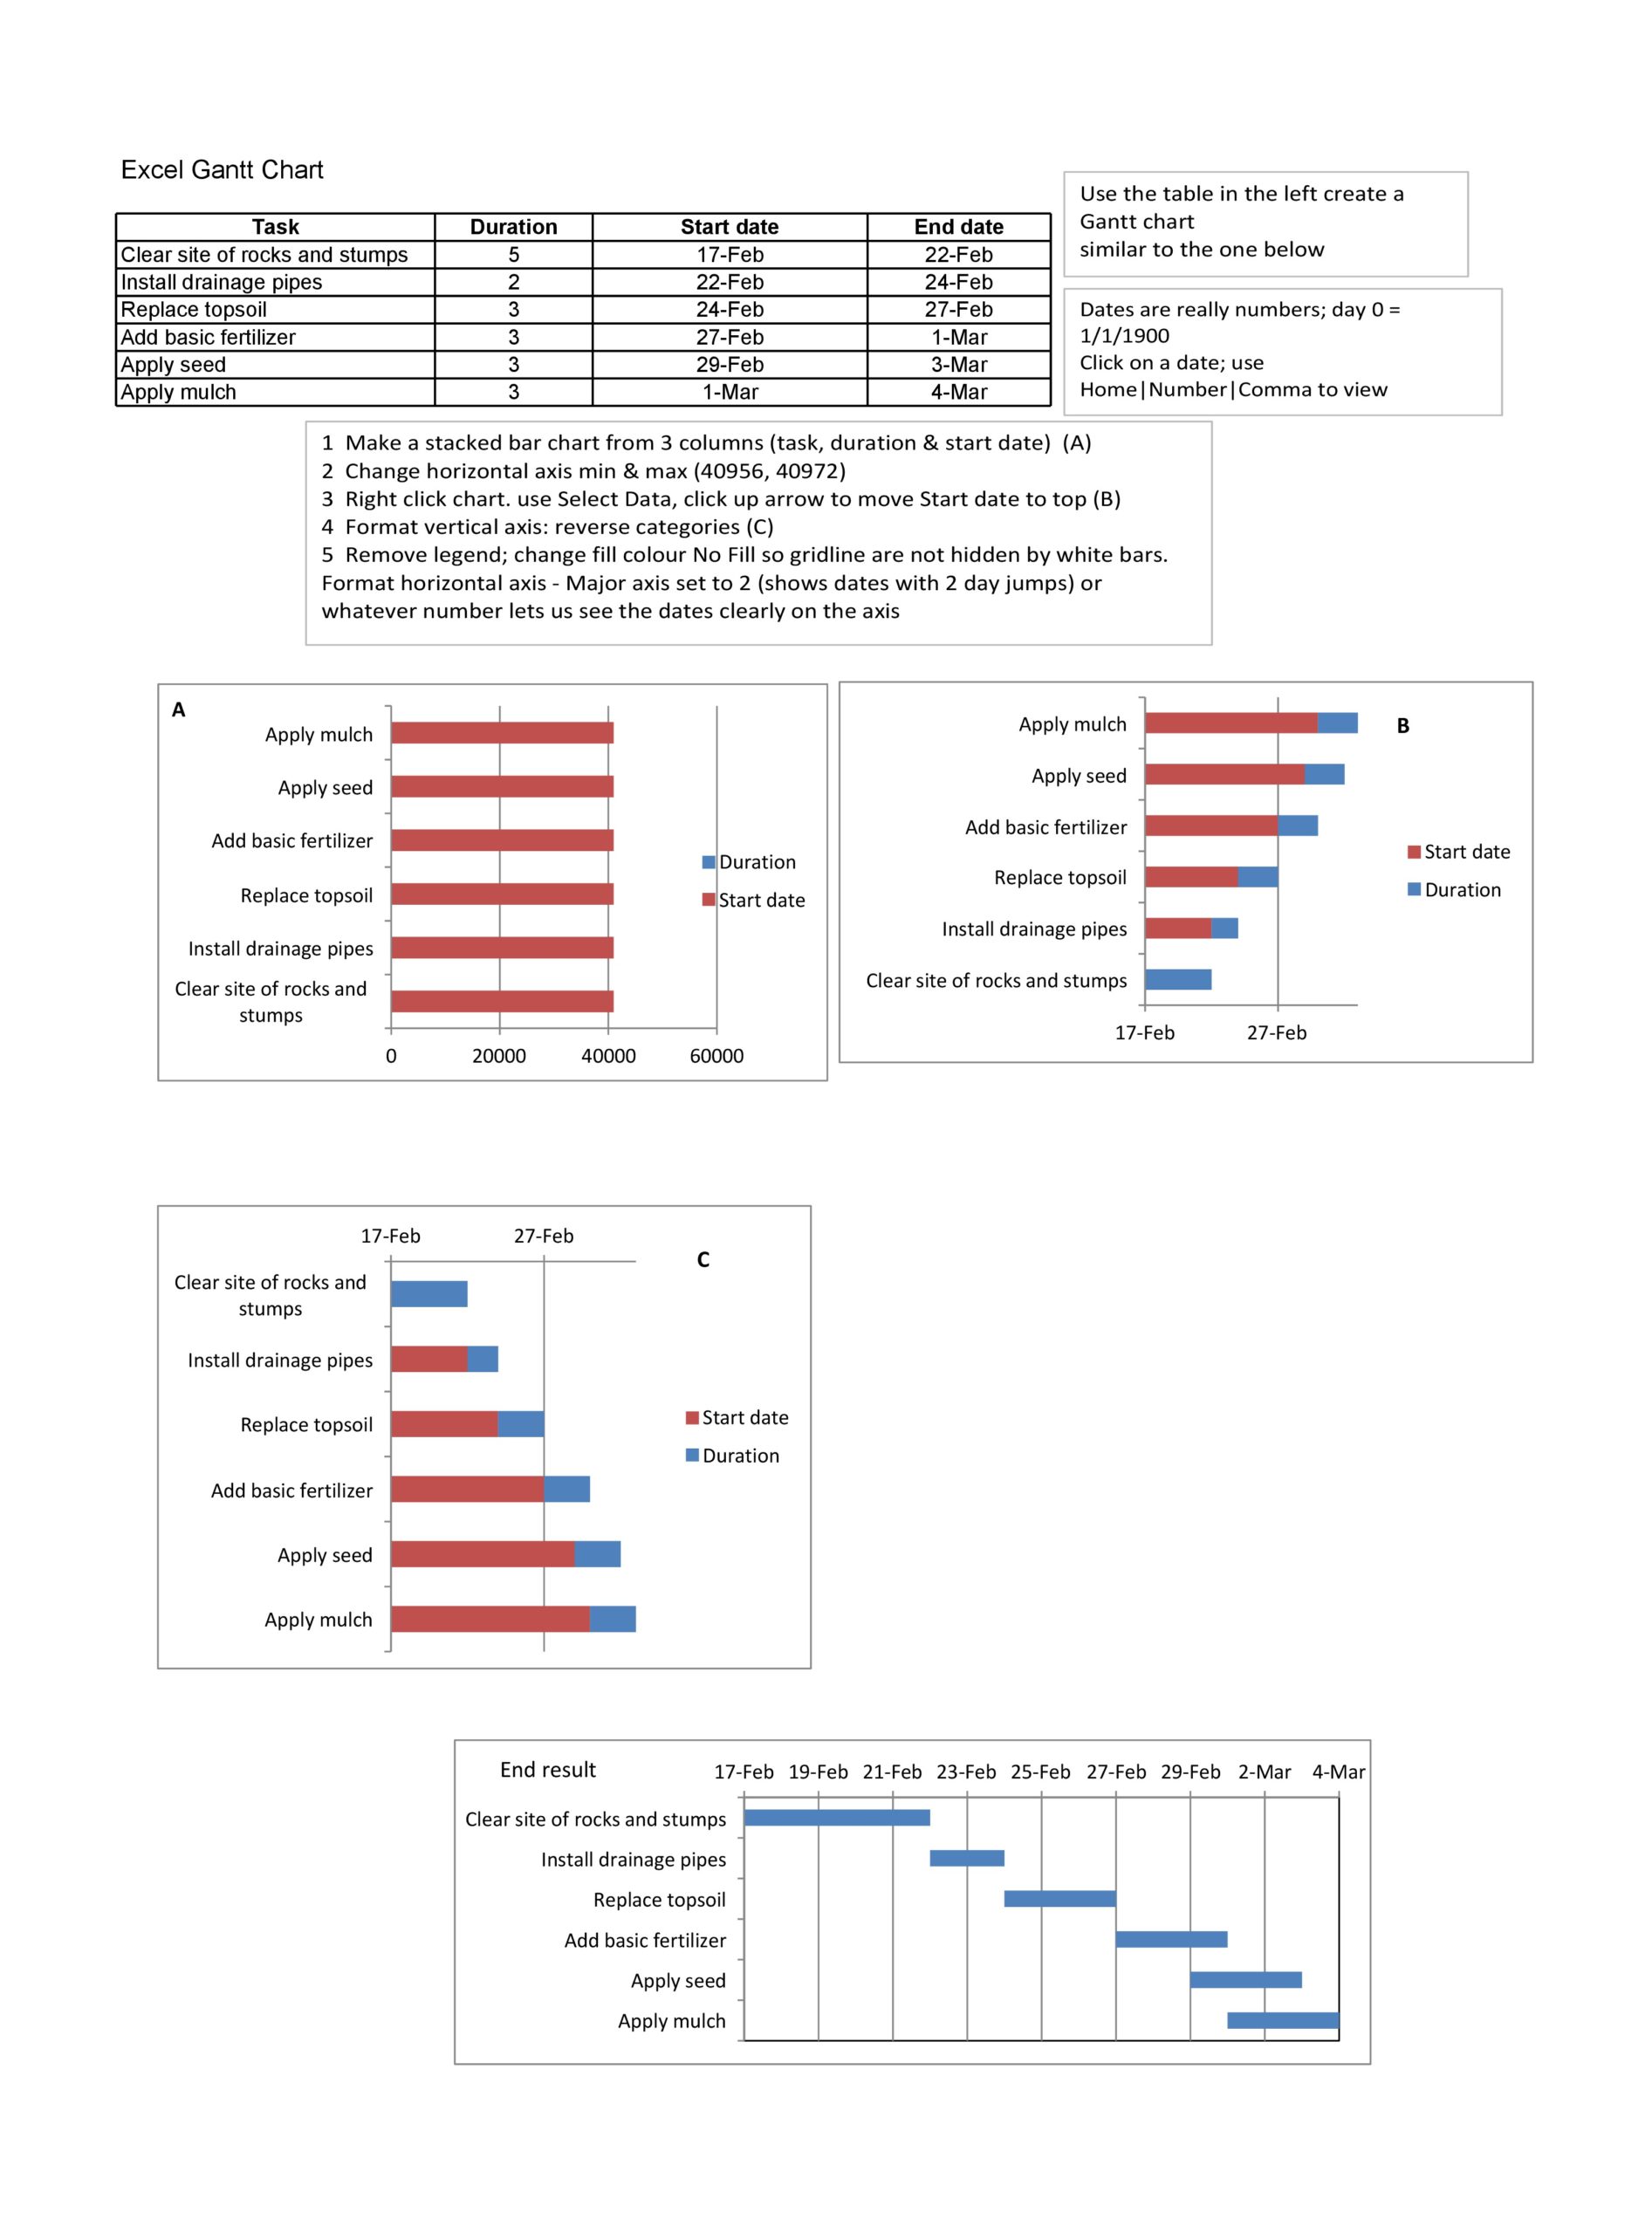
Excel Gantt Charts


Tips for creating a Gantt chart
Many businesses today use Gantt charts to monitor and describe their projects based on standard project management rules. These are now easier to create using computer applications. Each application has its own capabilities and features. For this, you first need a comprehensive project plan before you can set up your chart.
A project plan contains a series of independent tasks that you need to perform in a specific order. For instance, when you move to a new workplace, you first have to sign the lease agreement before you can start renovating the space.
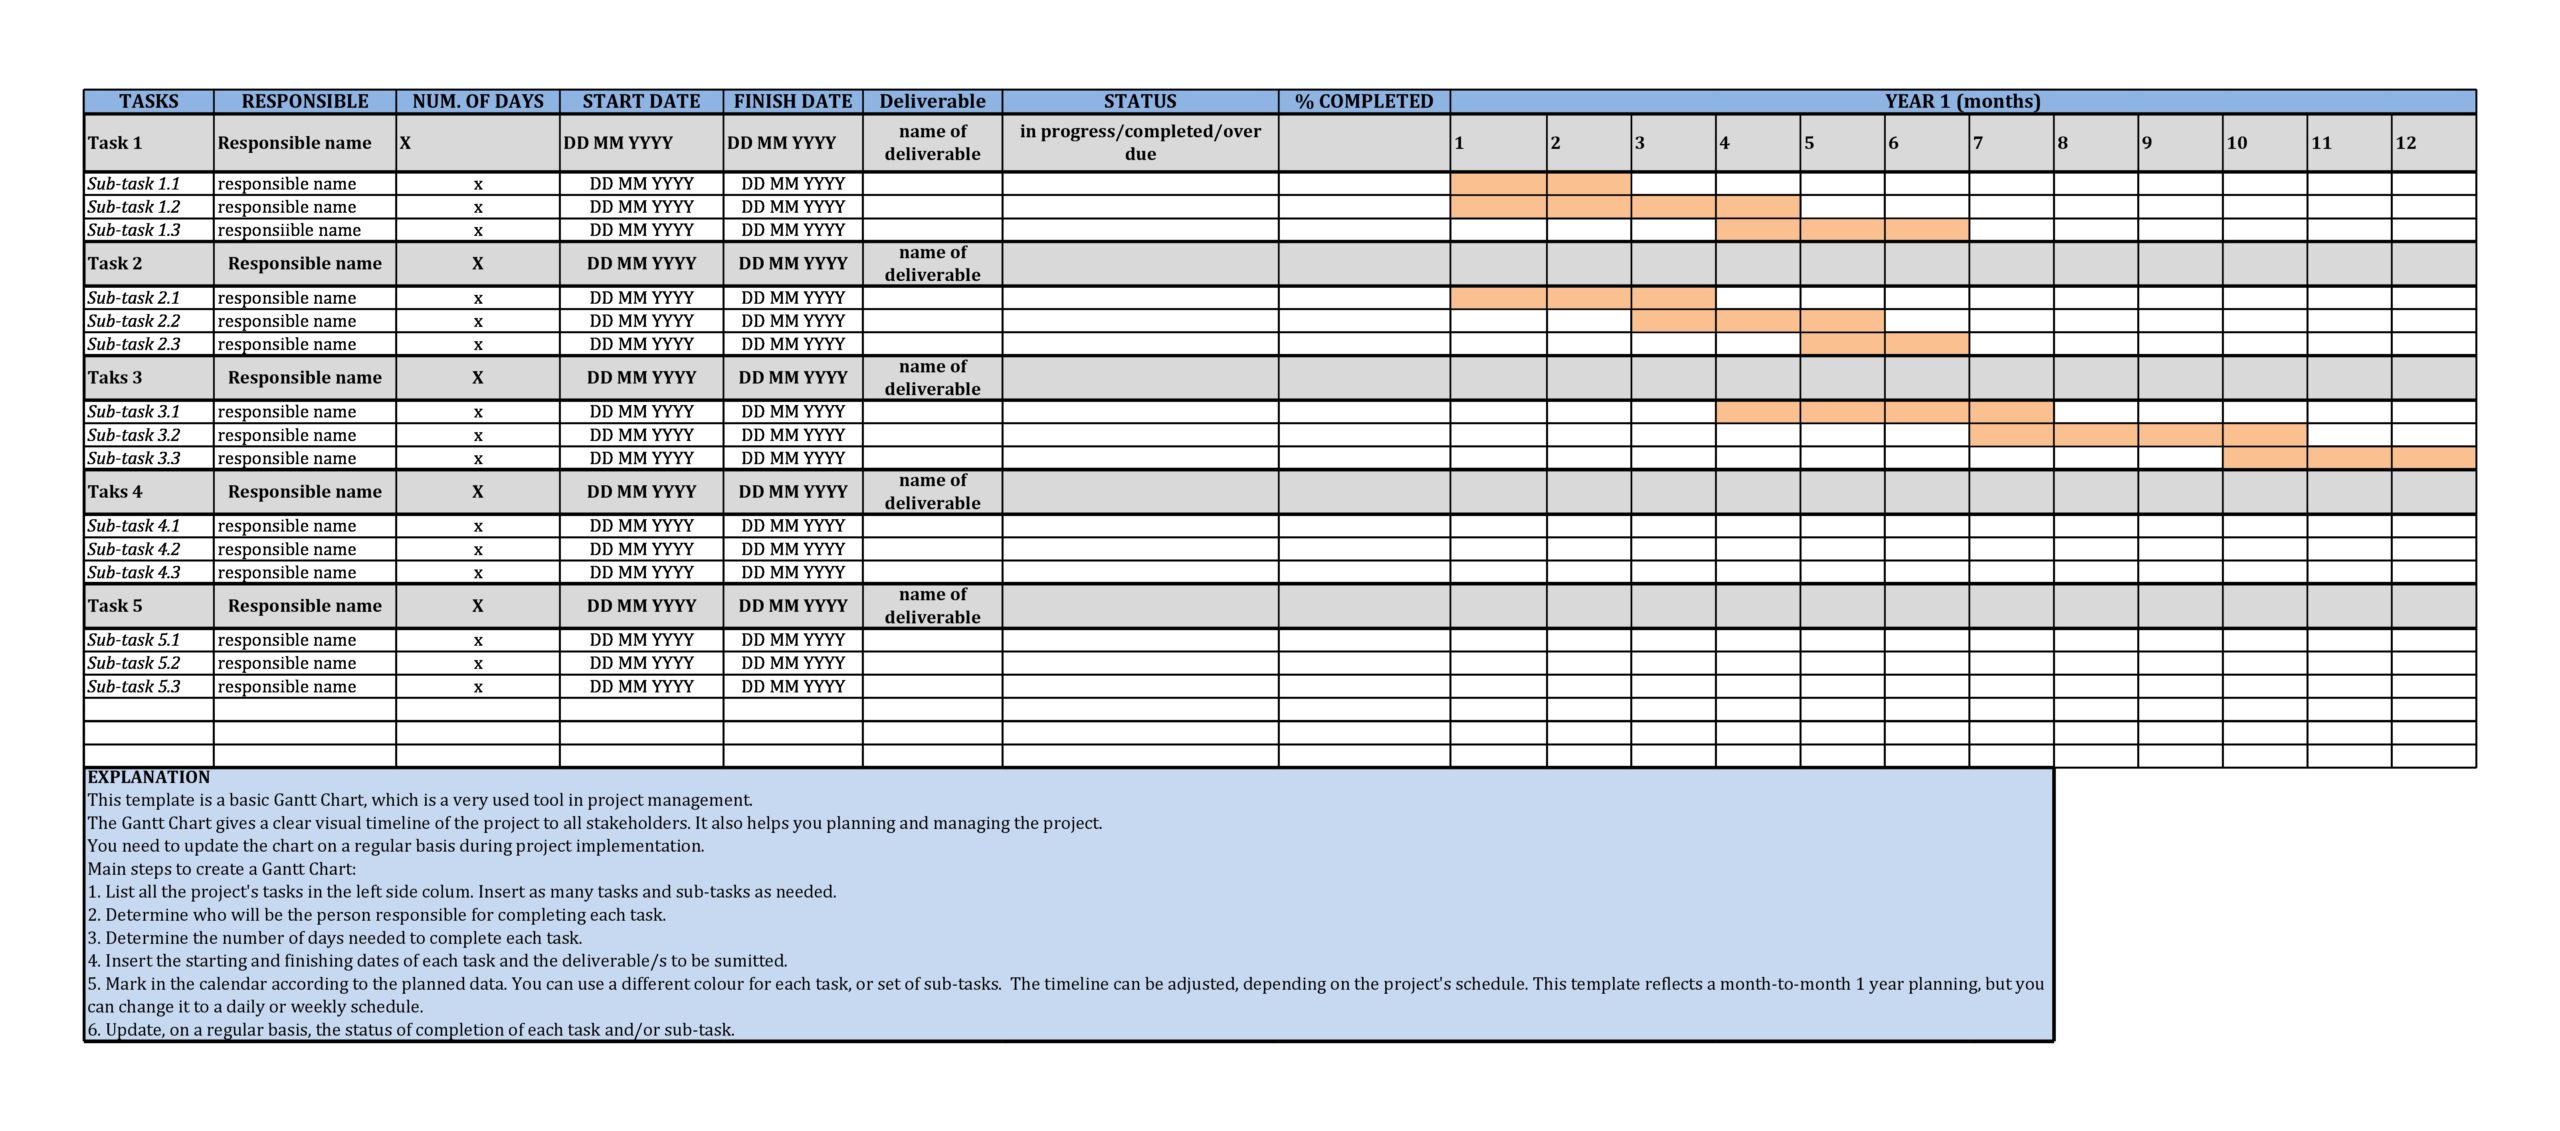
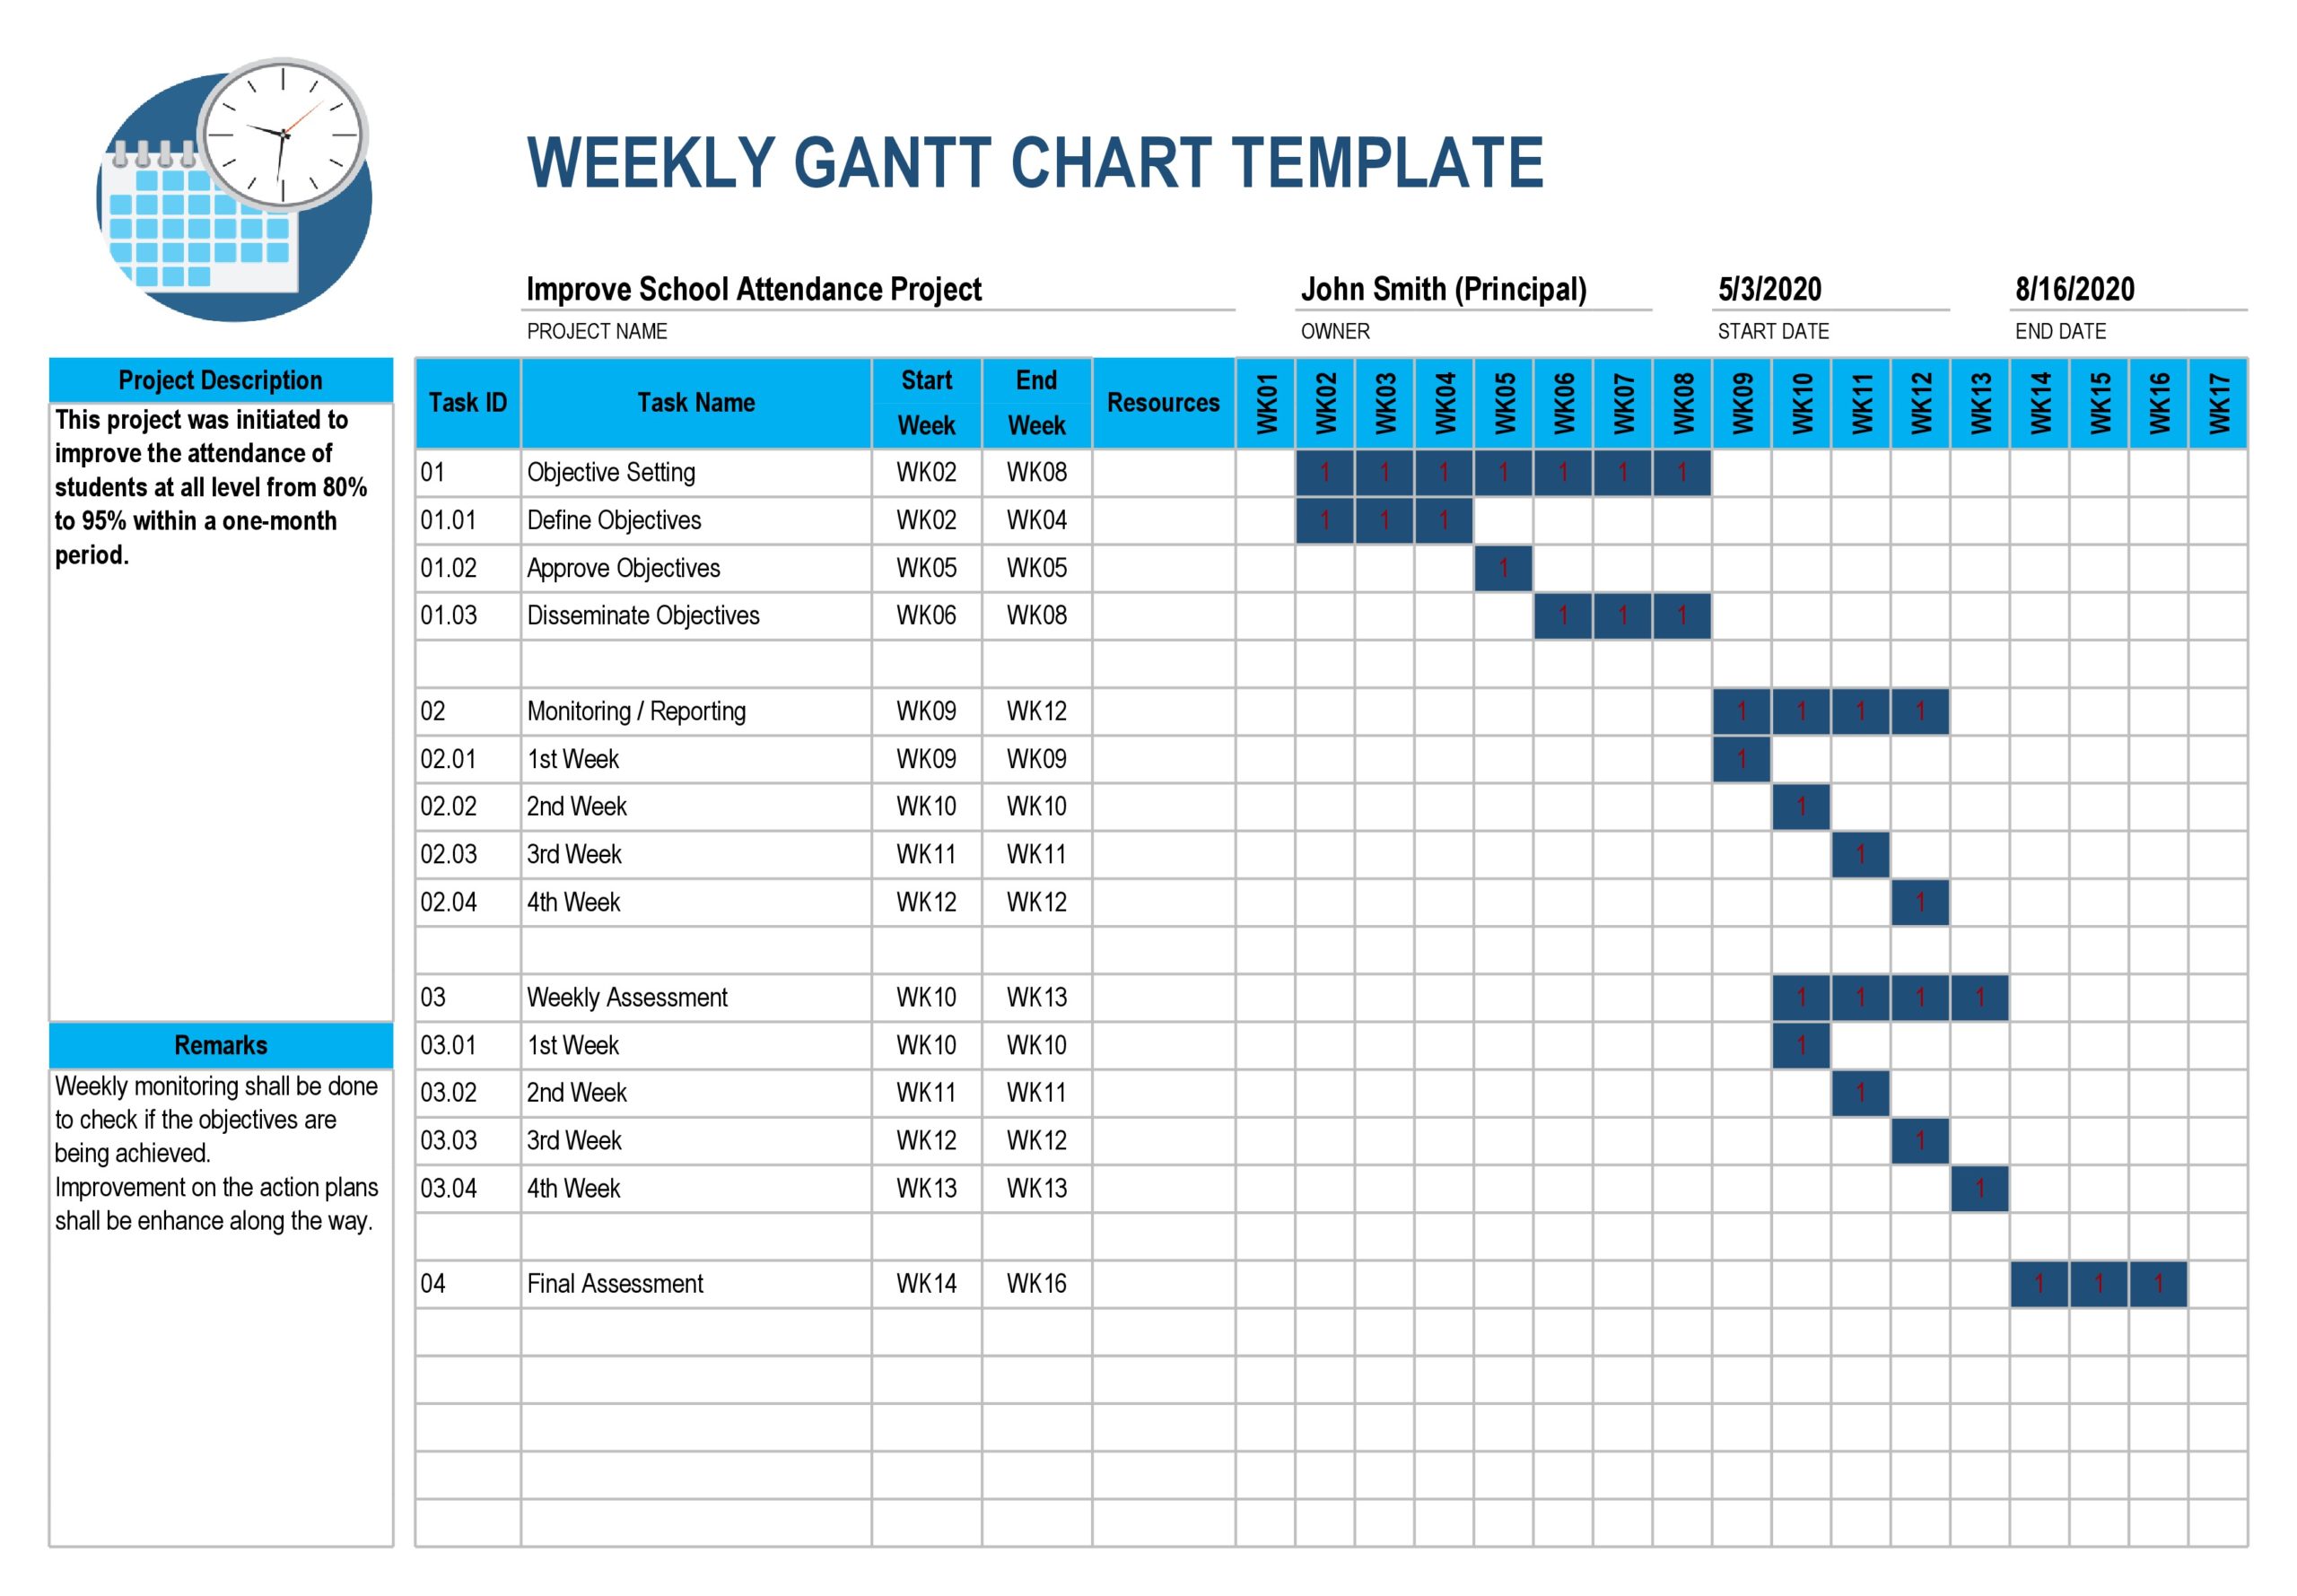
Every project plan should have a start date that should correspond to the date when you start the first task and an end date that should also correspond to the date the final task ends. One recommended way to make a project plan is to create a work breakdown structure.
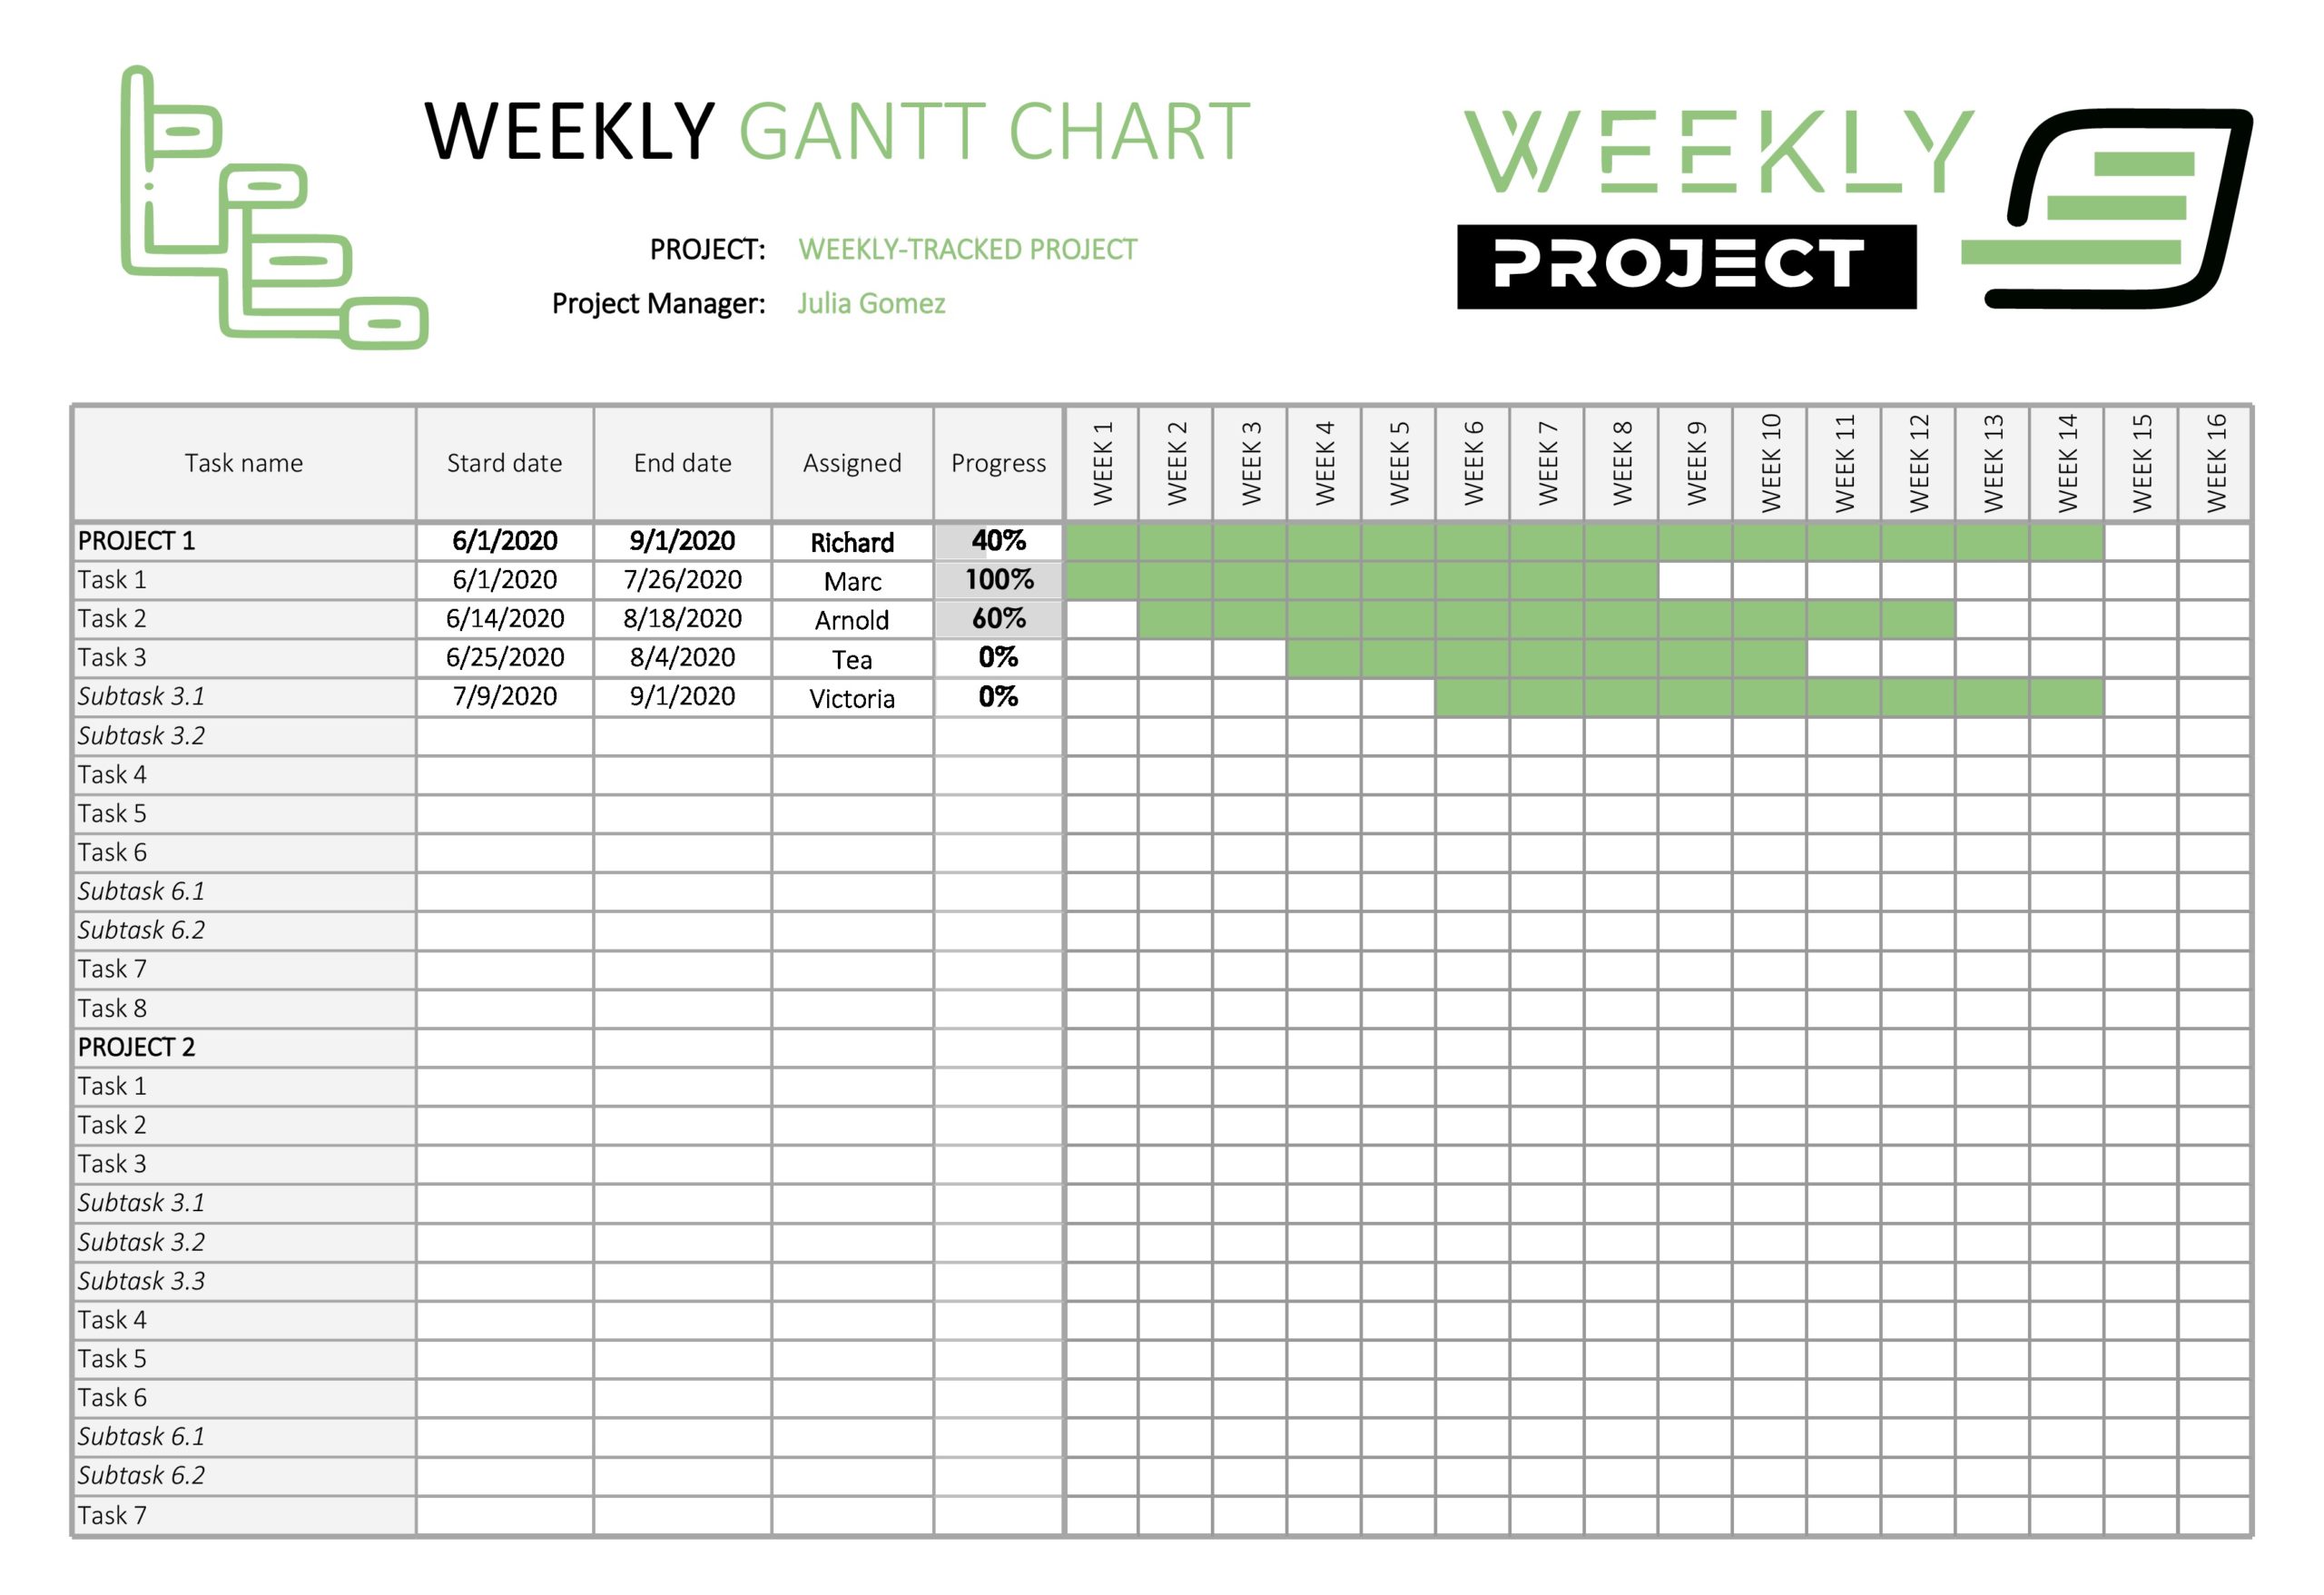
This refers to a technique where you split tasks into smaller tasks to create a task hierarchy. Applications for making such charts most likely permit you to show this task hierarchy on the tasks list itself.
Task Hierarchy
Software for mind mapping promotes creative thinking which can help you create a work breakdown structure. This is an assurance that nothing will get left out from the whole project plan. There are mind mapping software that incorporate Gantt charting which enable you to input data while developing the plan.
This could save you some time later on. You have to make sure to complete your plan with realistic assumptions. Once you have completed your project plan, simply input the data and the application creates the chart. Here are some steps to guide you:
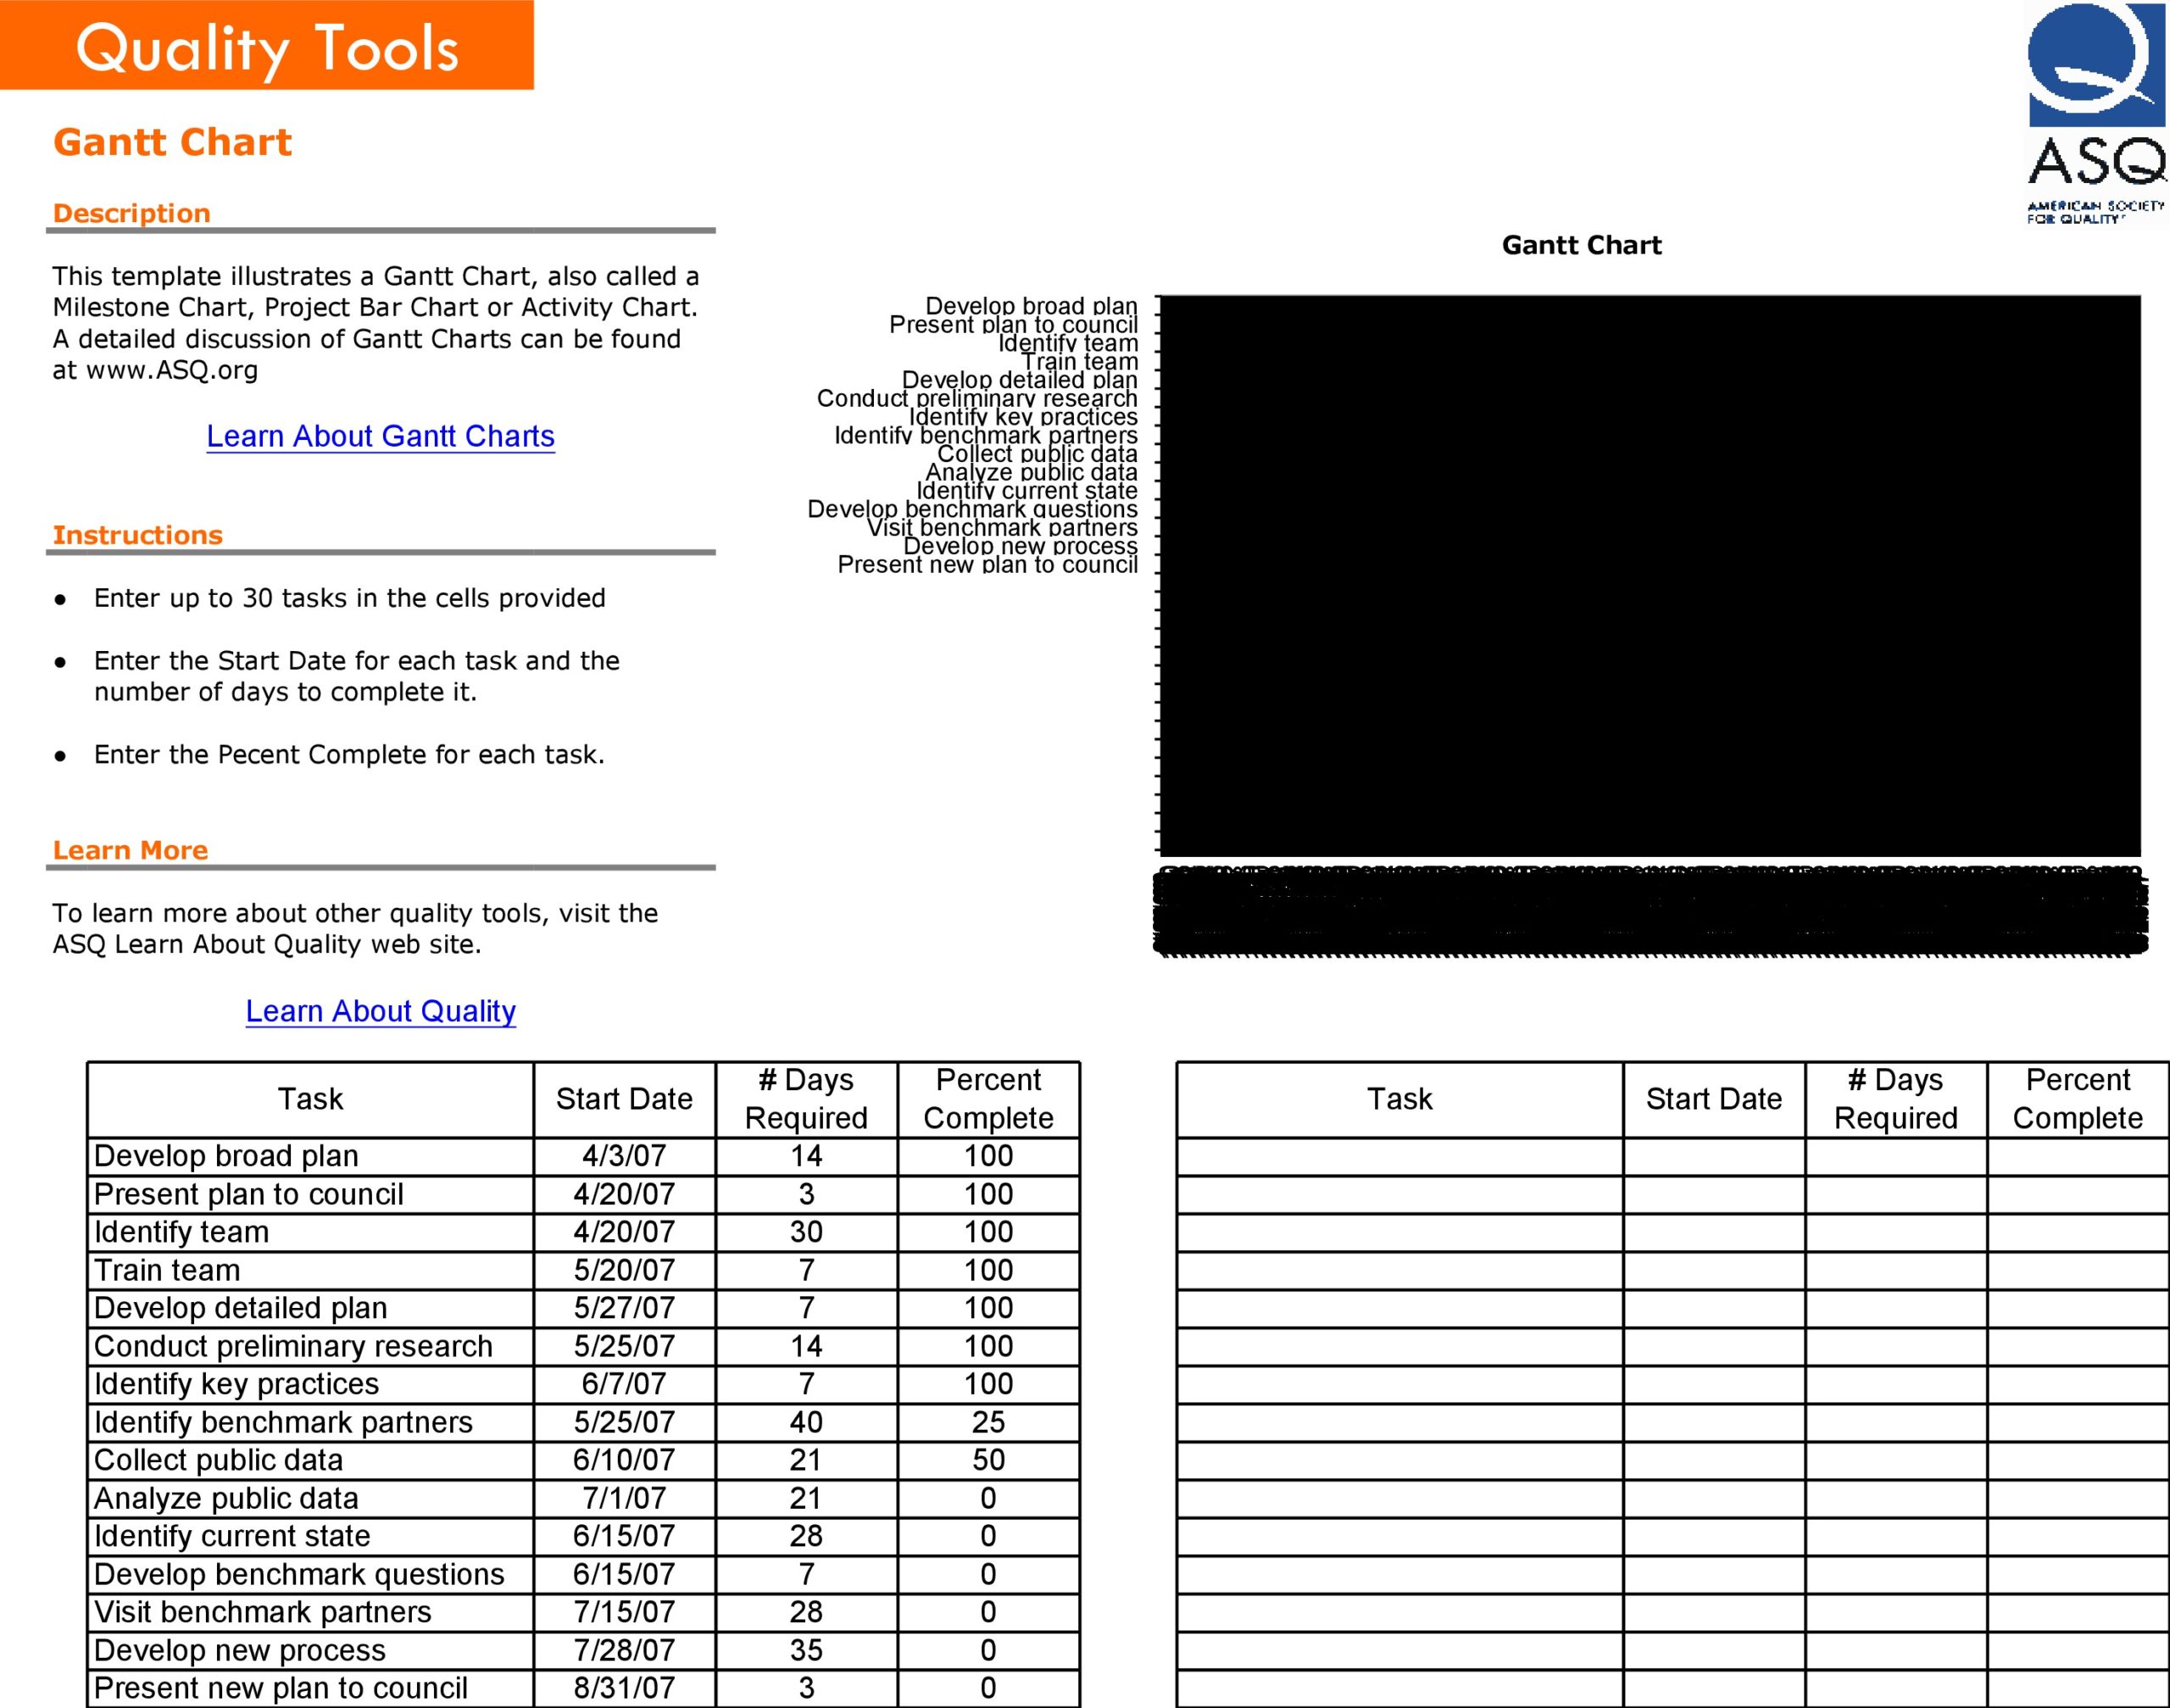
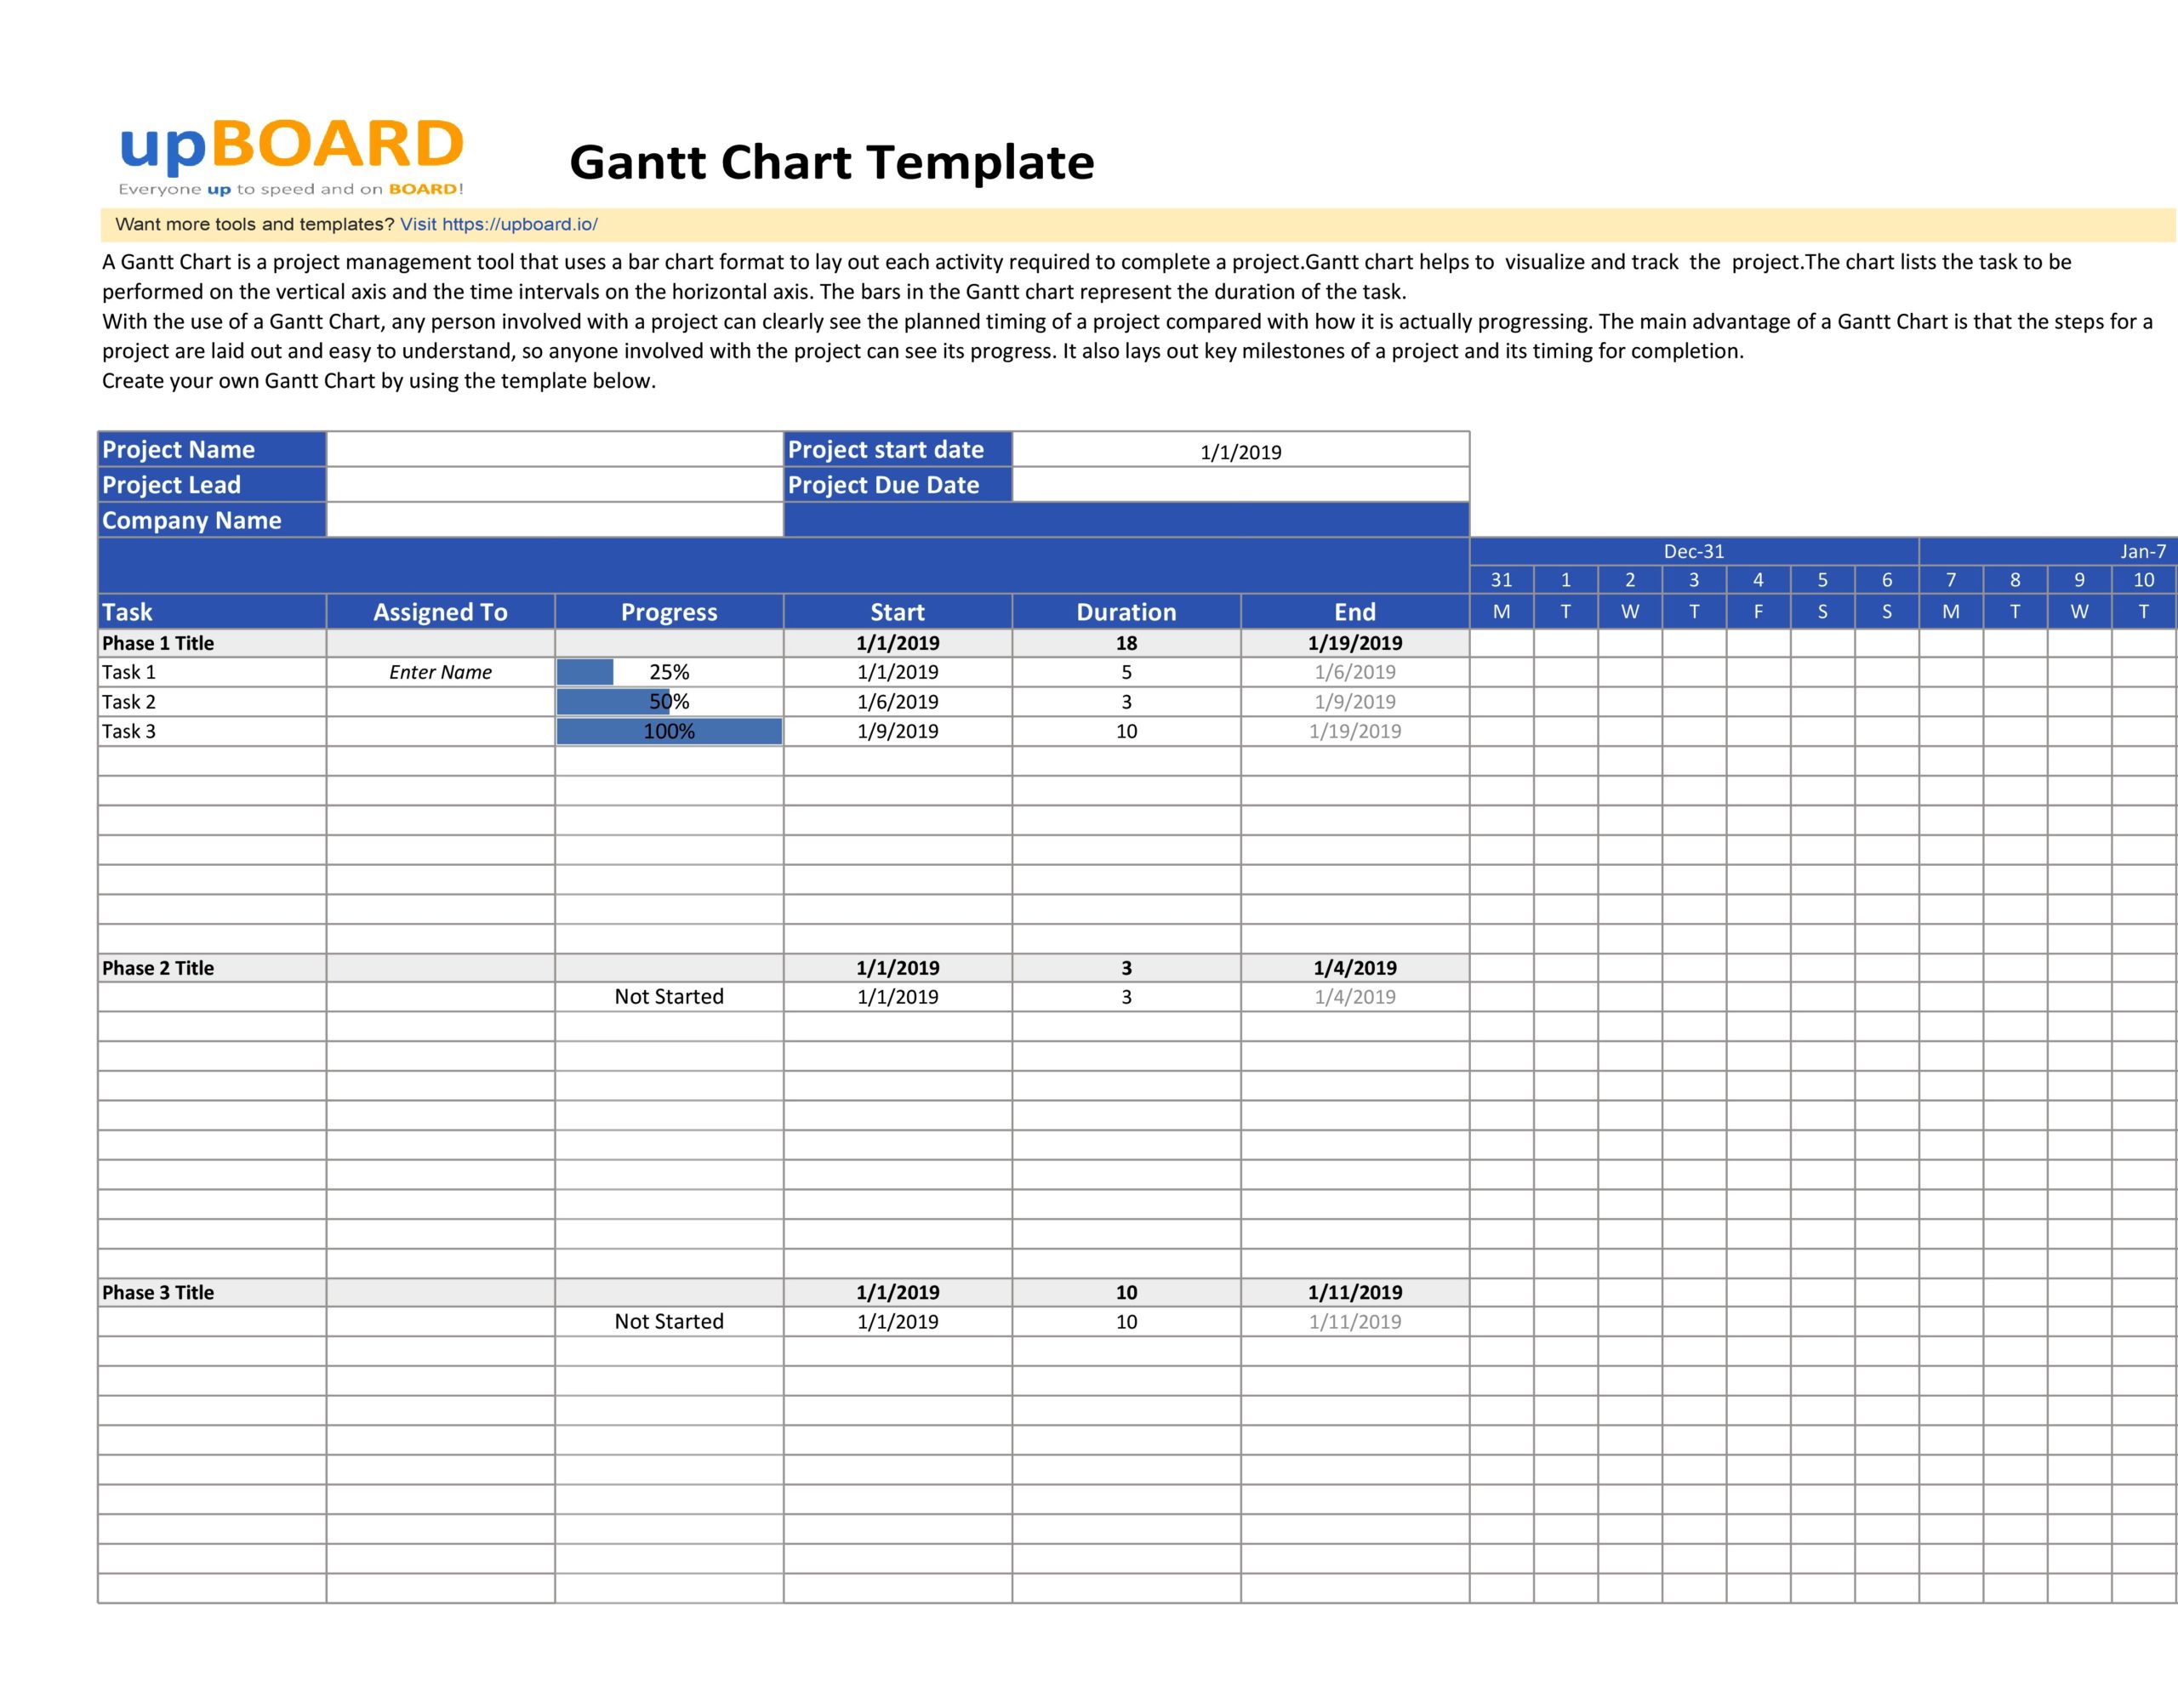
- Define the settings of the project including the start date, completion date, and the scheduling mode. The most common mode for scheduling is to move forward from the start date of the project. With this mode, tasks begin as soon as possible to ensure that the entire project gets completed at the earliest date possible.
- Define your project calendar. This involves setting how many working days each week, how many working hours each day, and so on.
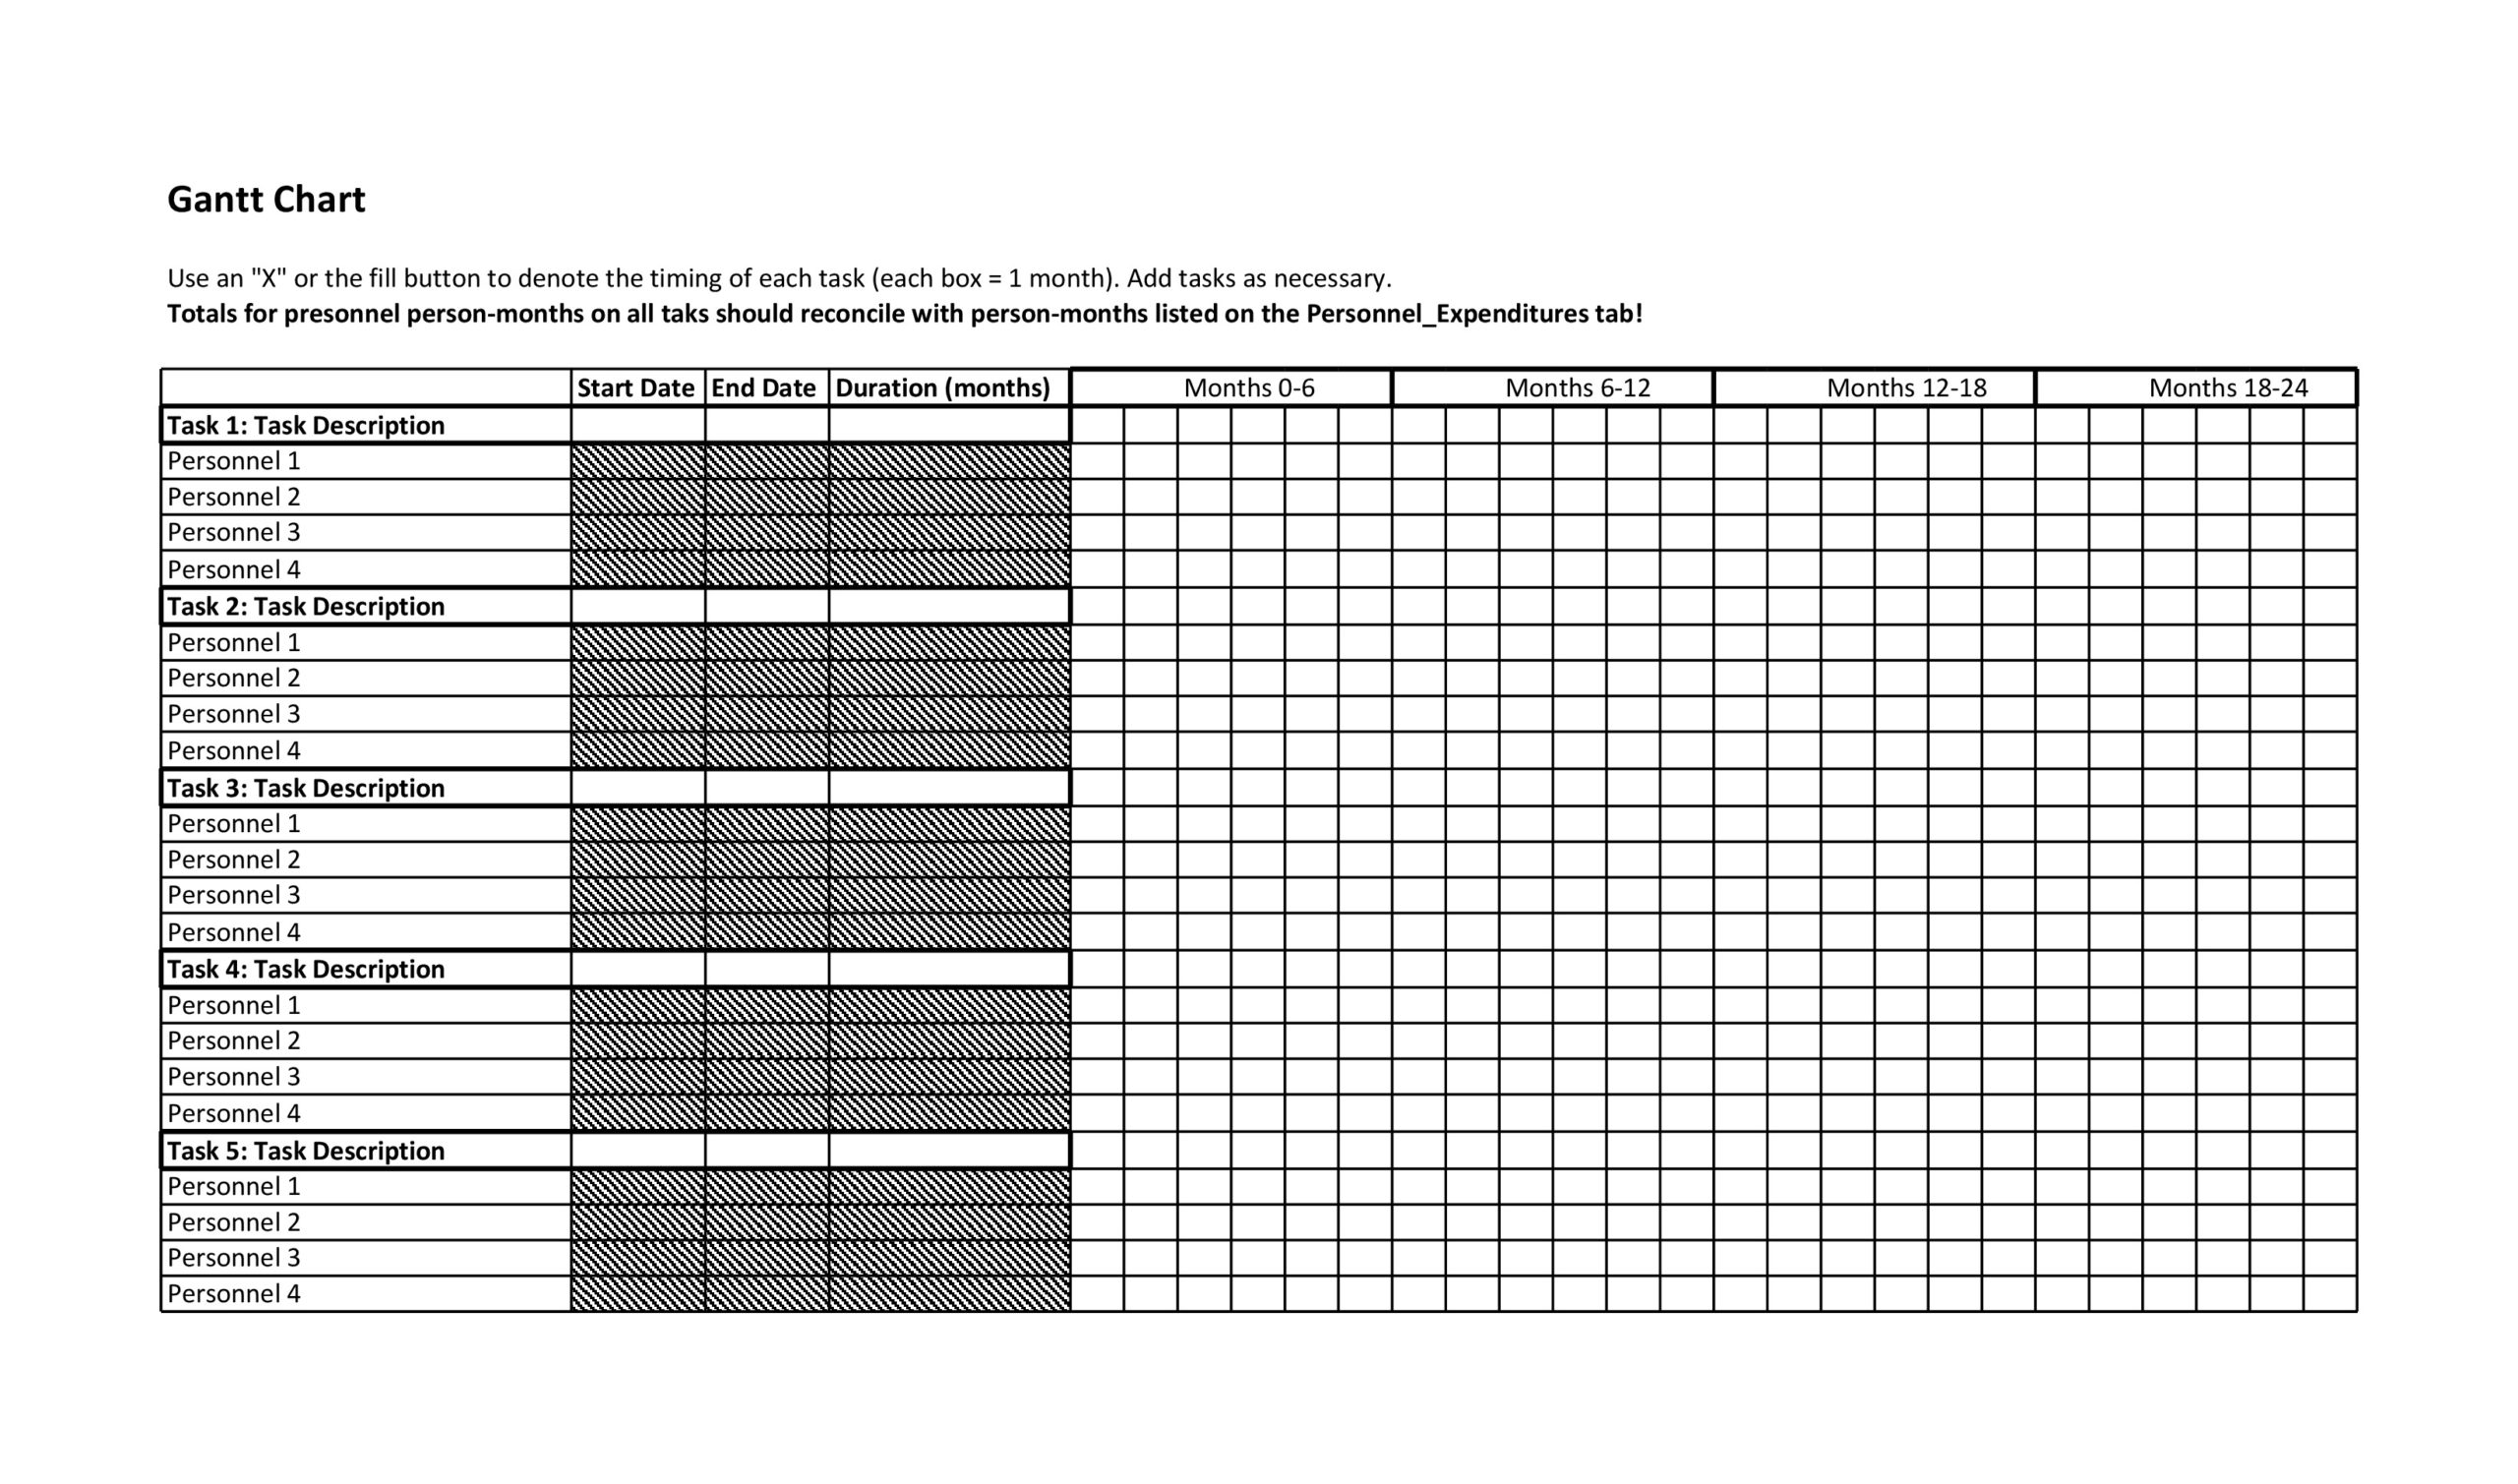
- Input the names of the task and their durations.
- Create a list of resources and assign those resources to the tasks. You can always define your resources when you discover the need for them but it’s faster to begin by creating a list of resources. From this, you can choose resources to allocate to the different tasks of your project.
- Create links for the purpose of specifying dependencies between your project’s tasks.
- Set limitations on each of the tasks.
- Make your final adjustments.
- Once your project starts, inspect its progress regularly to identify any scheduling conflicts or other kinds of potential issues. Make corrections if needed.
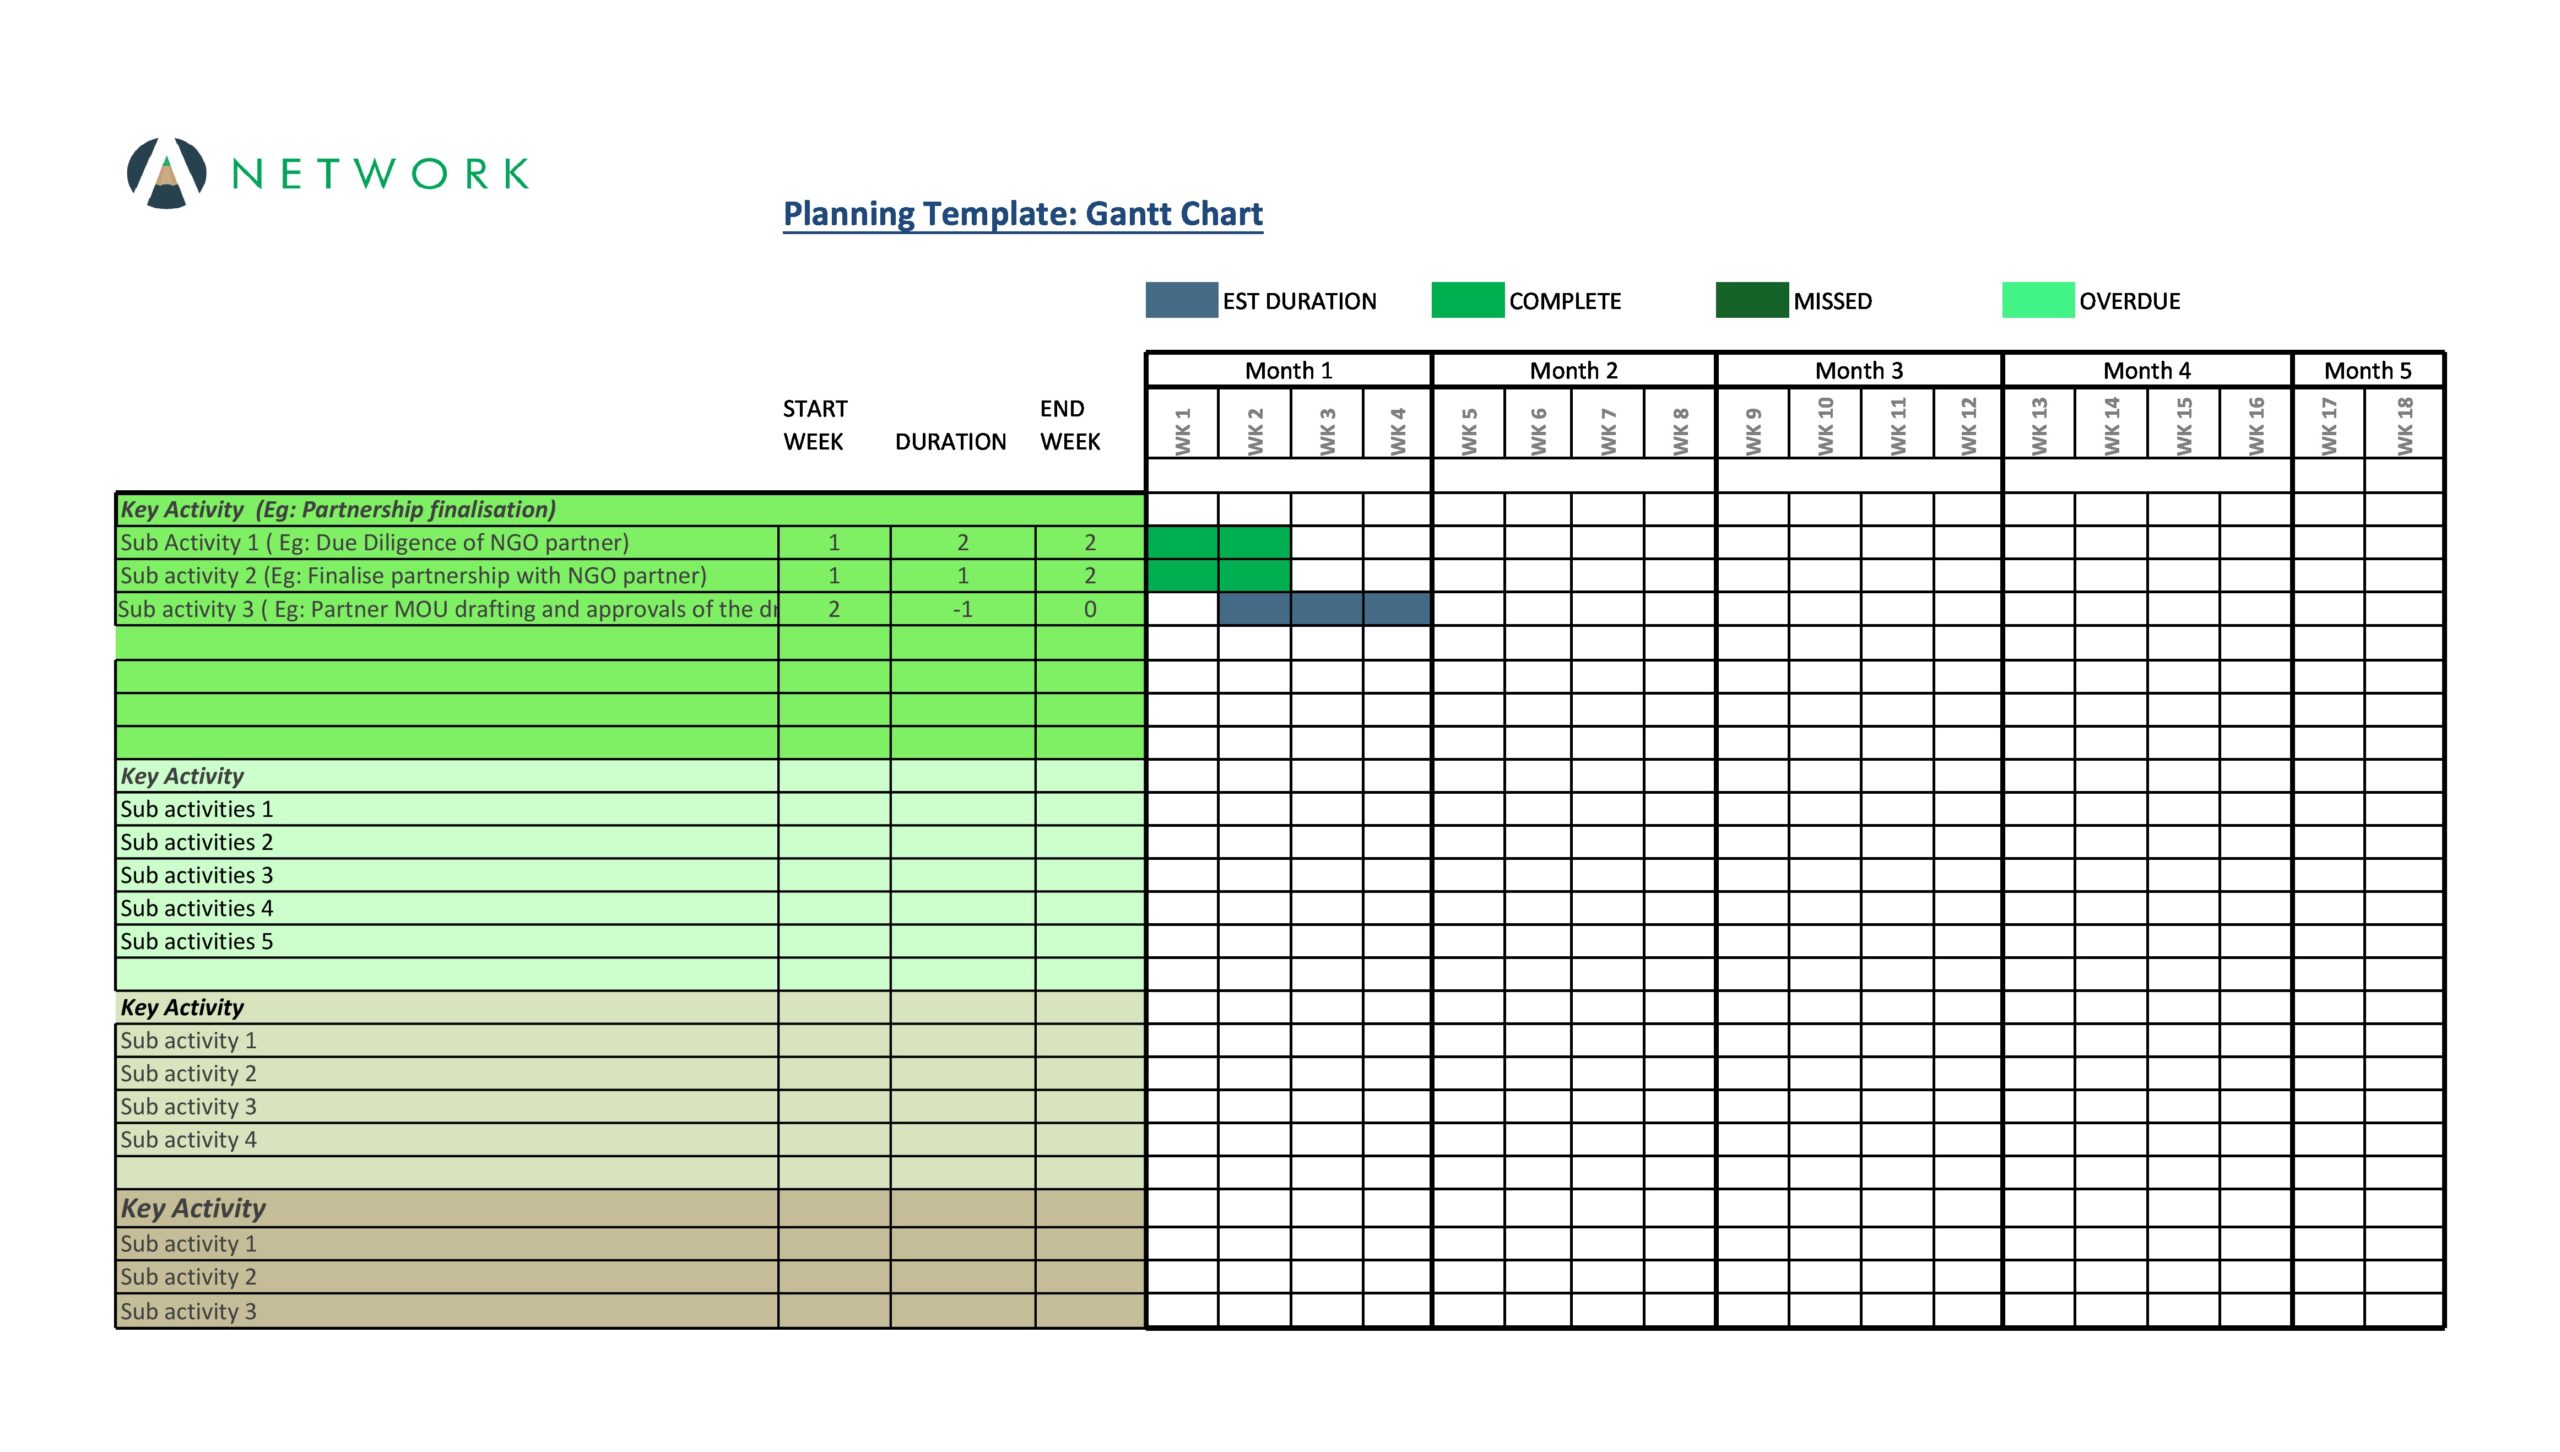
The Gantt application shows you the free Gantt chart template after entering all of the required data. Making any changes, especially in the timing of the tasks can affect the rest of the tasks dependent on it.
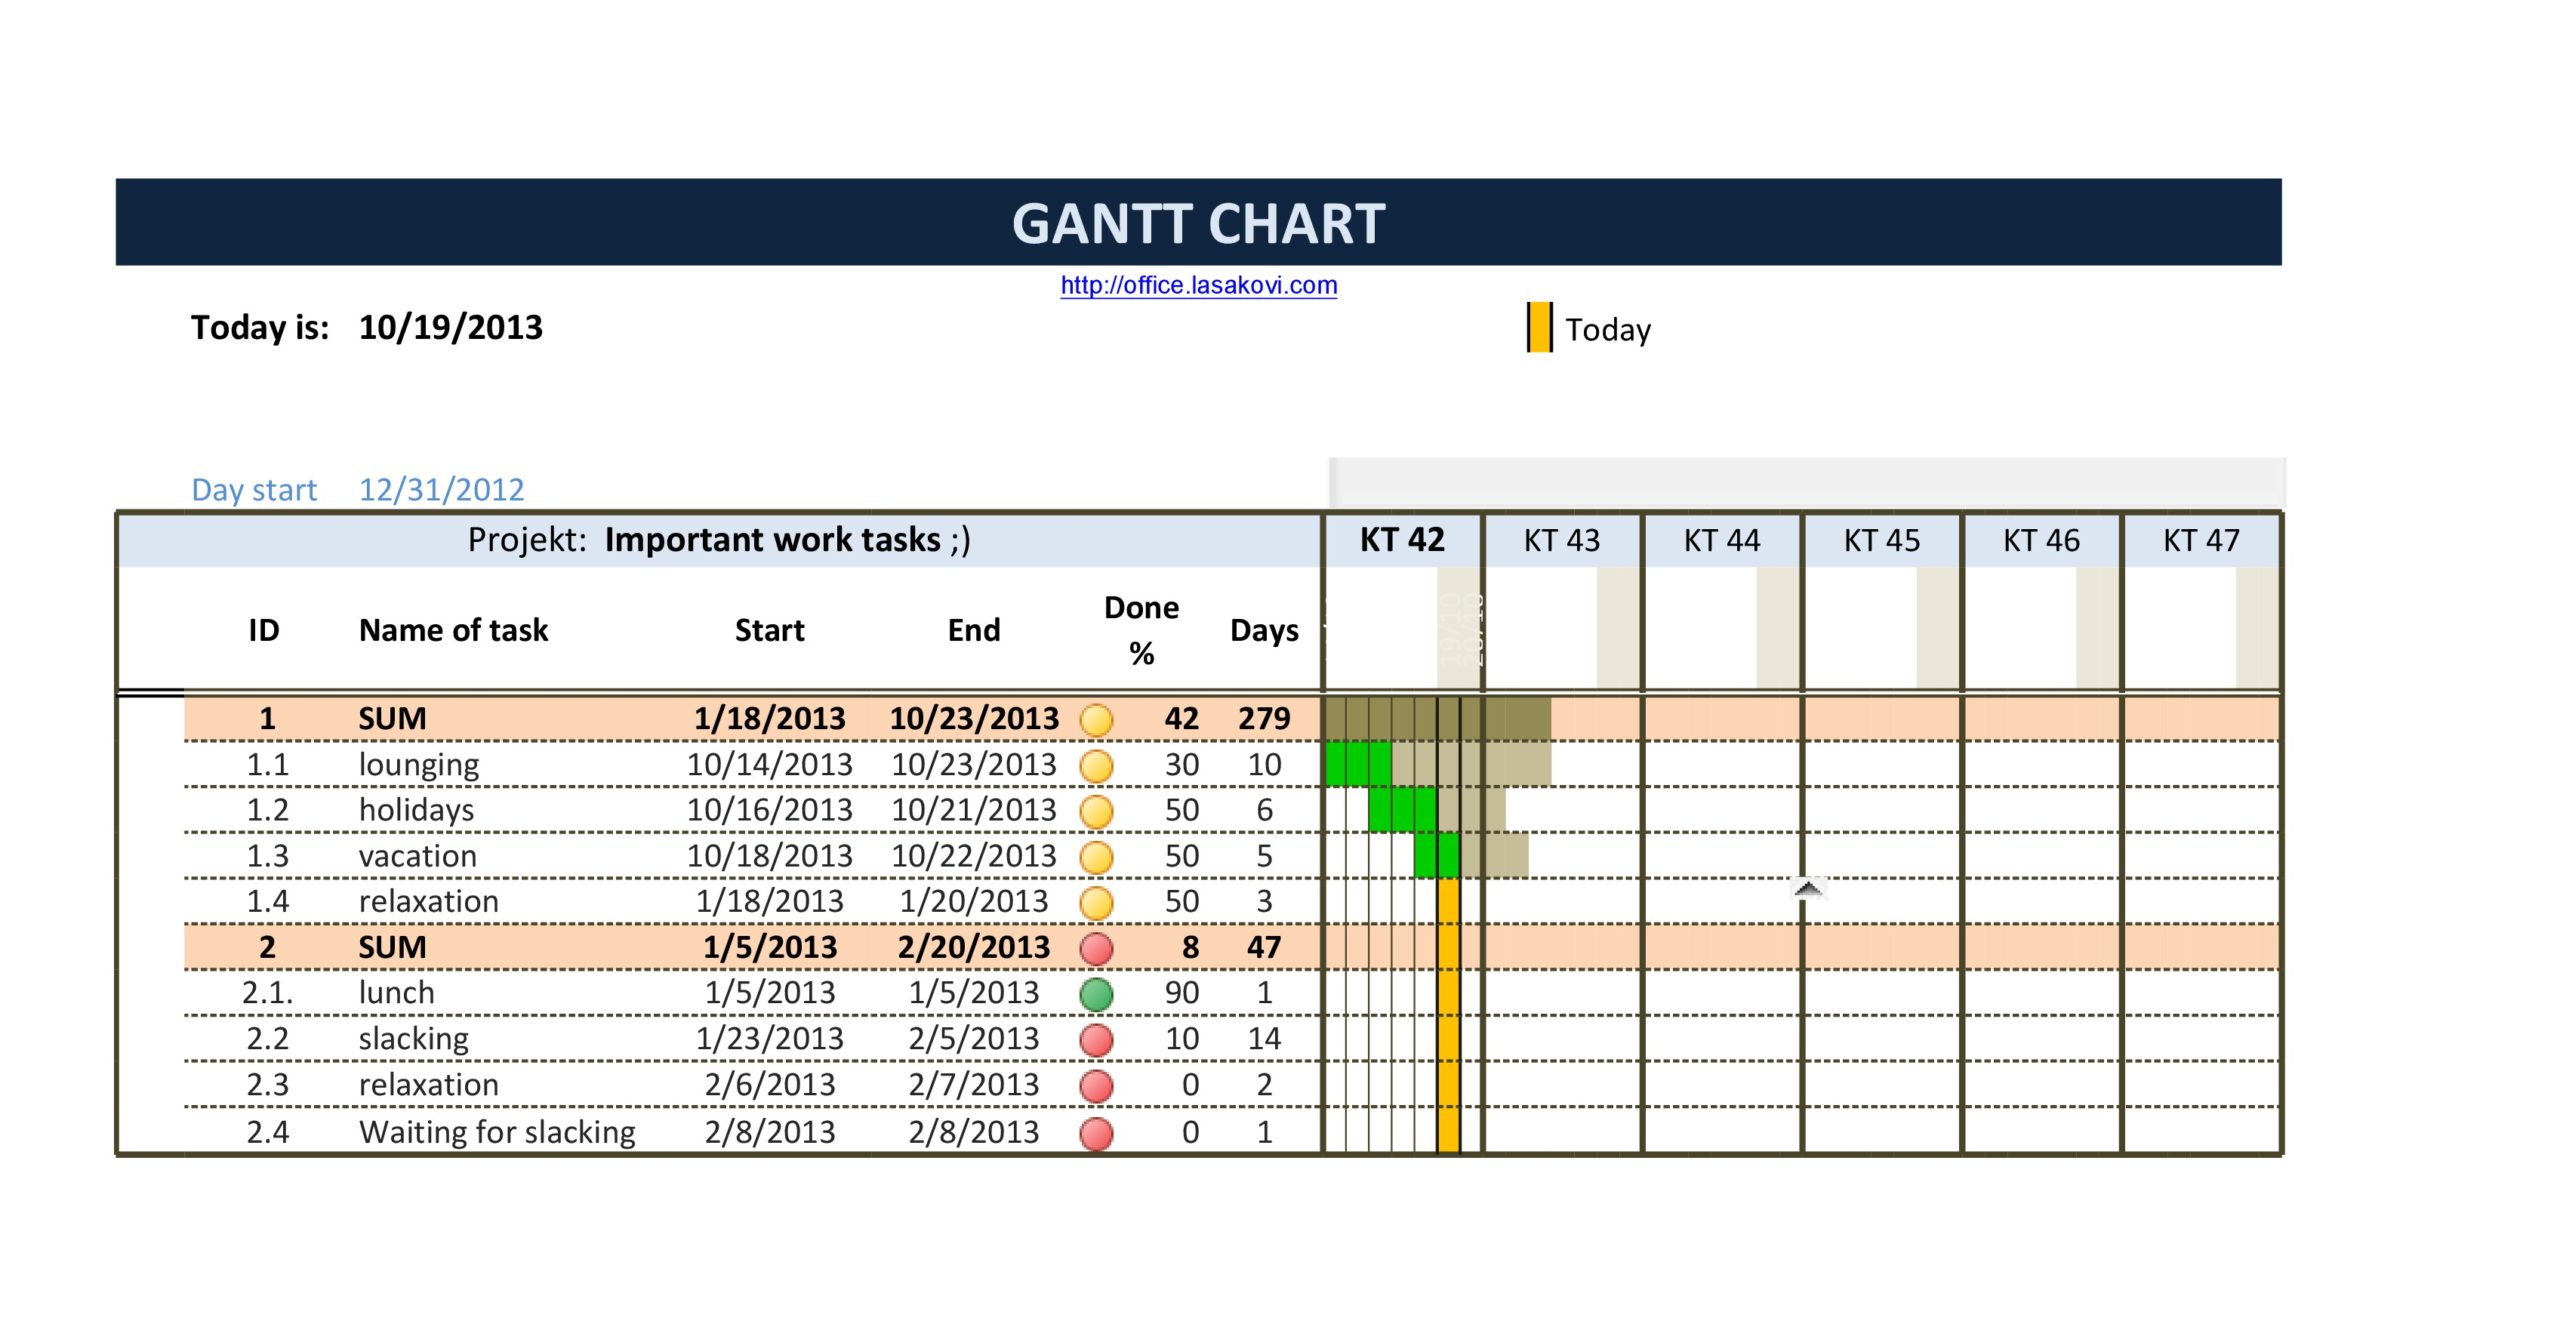
Simple Gantt Charts
Linking Tasks
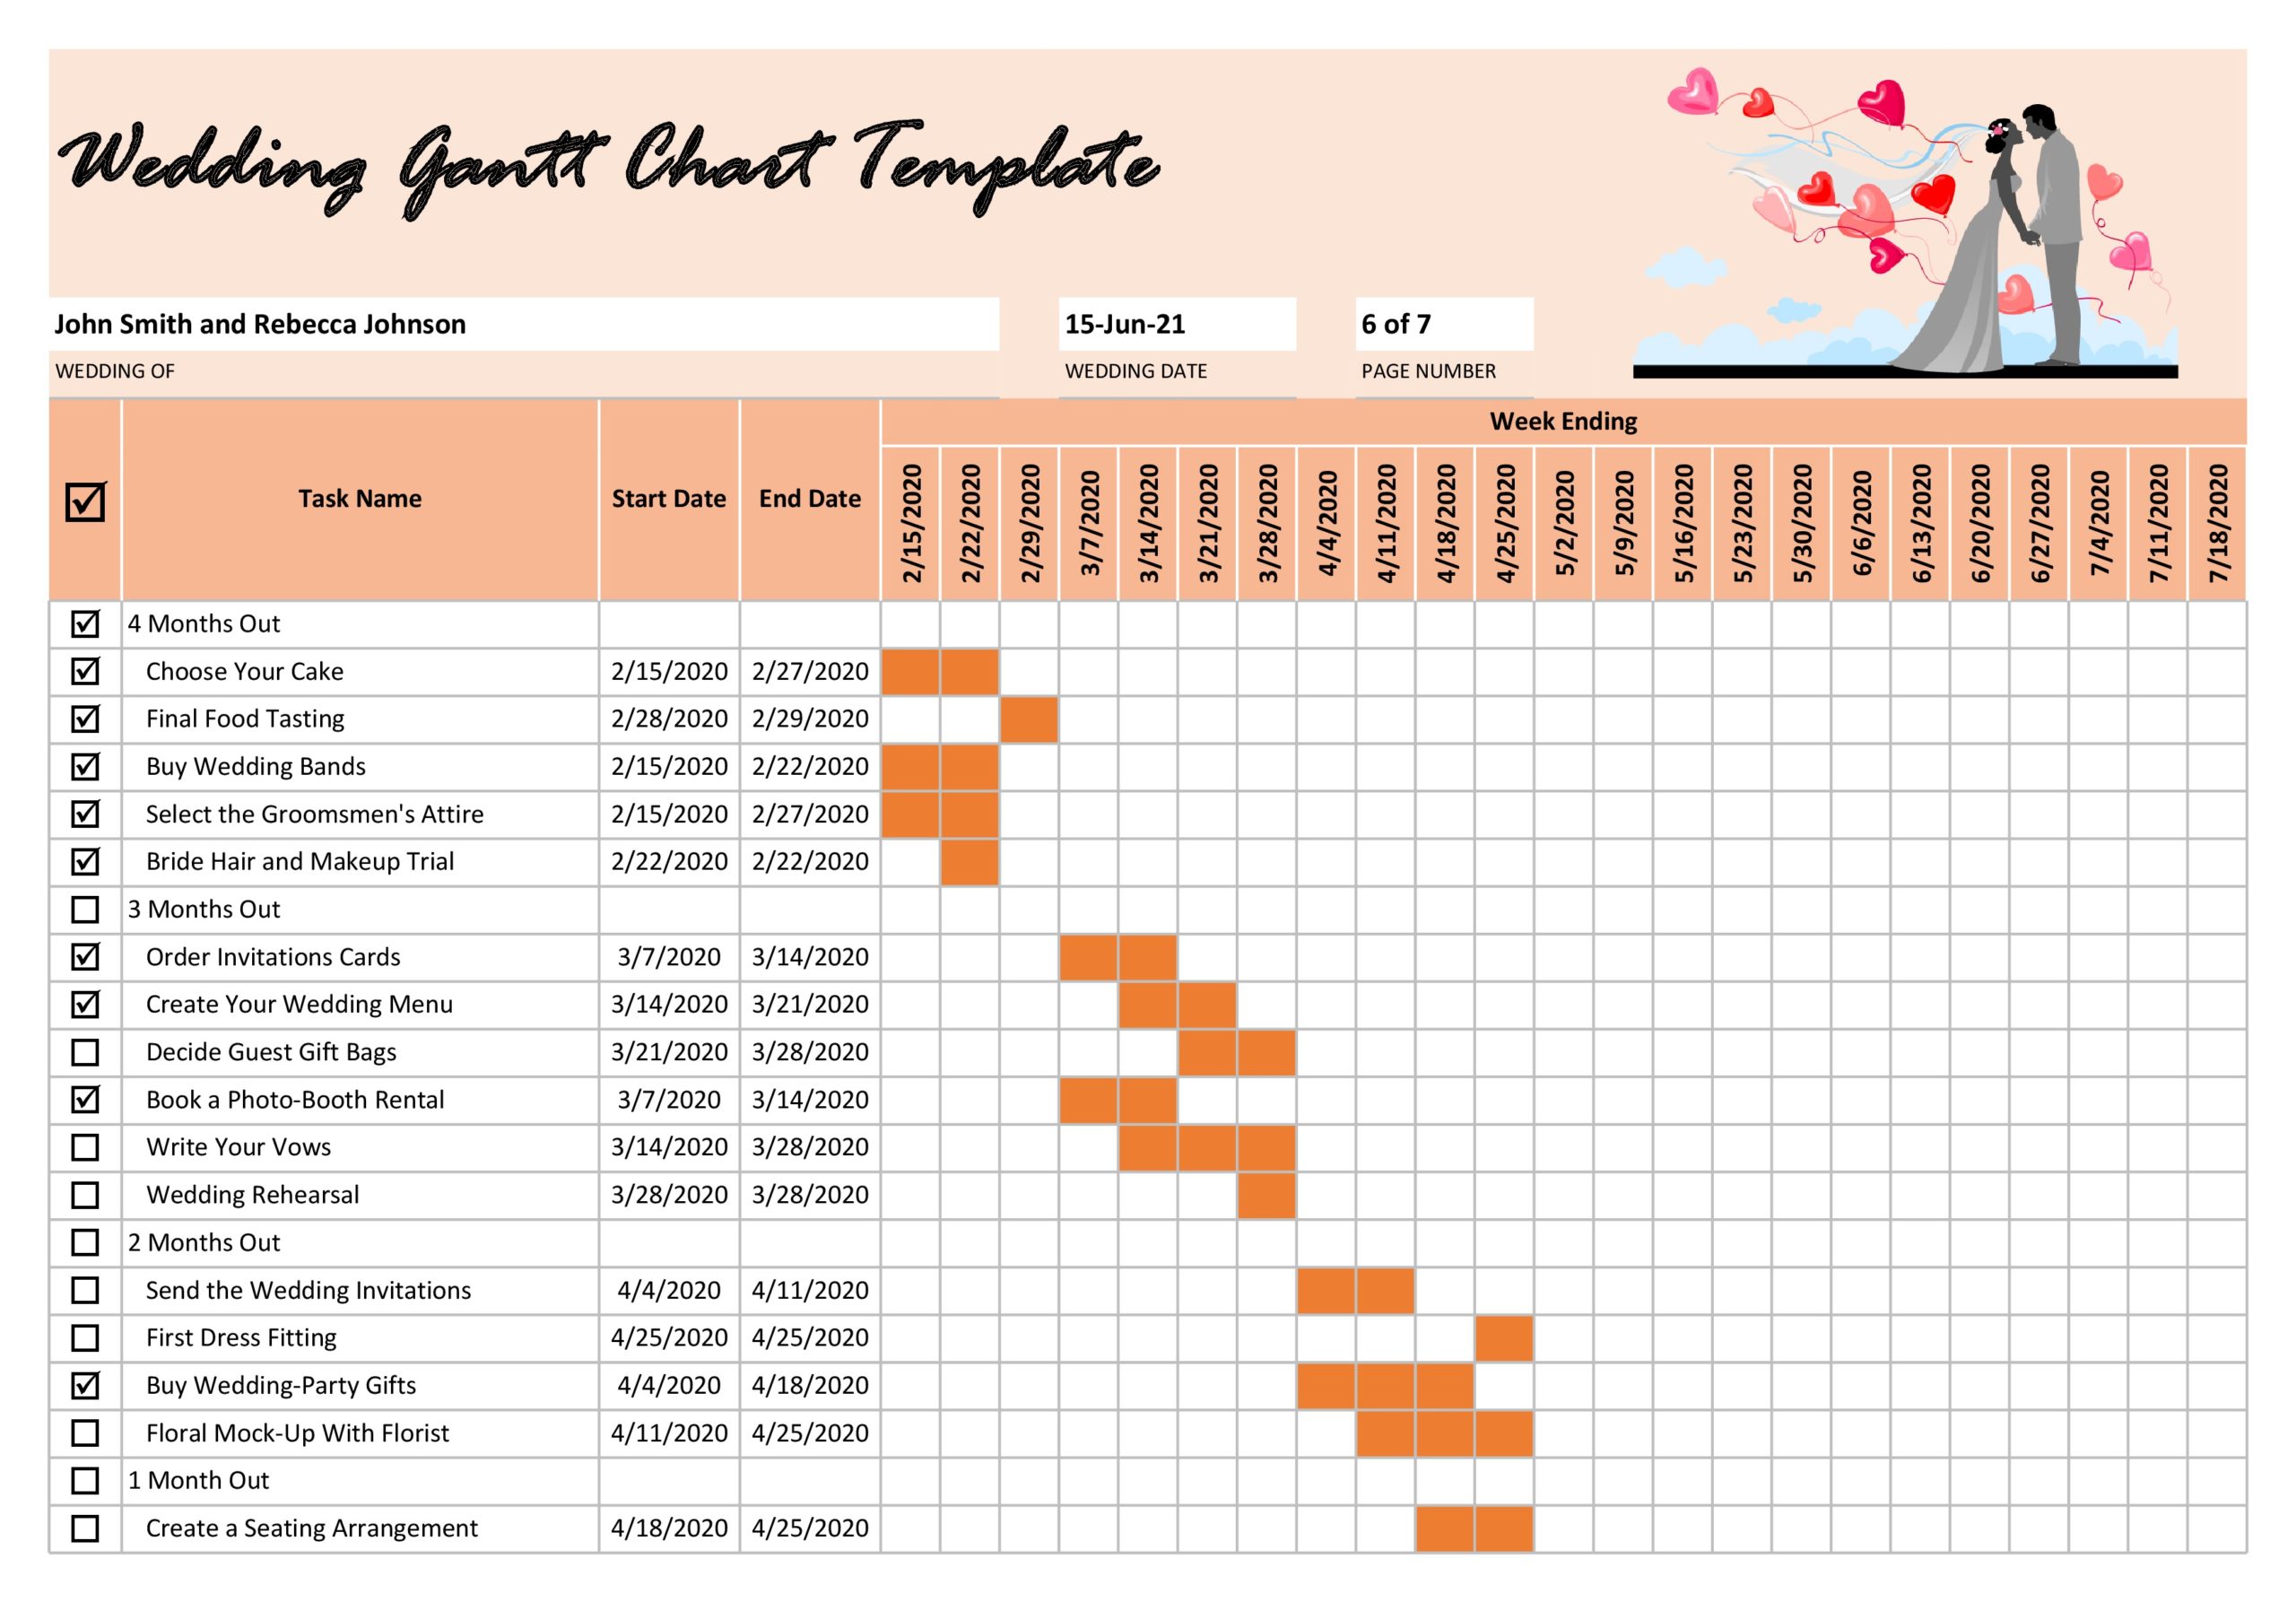
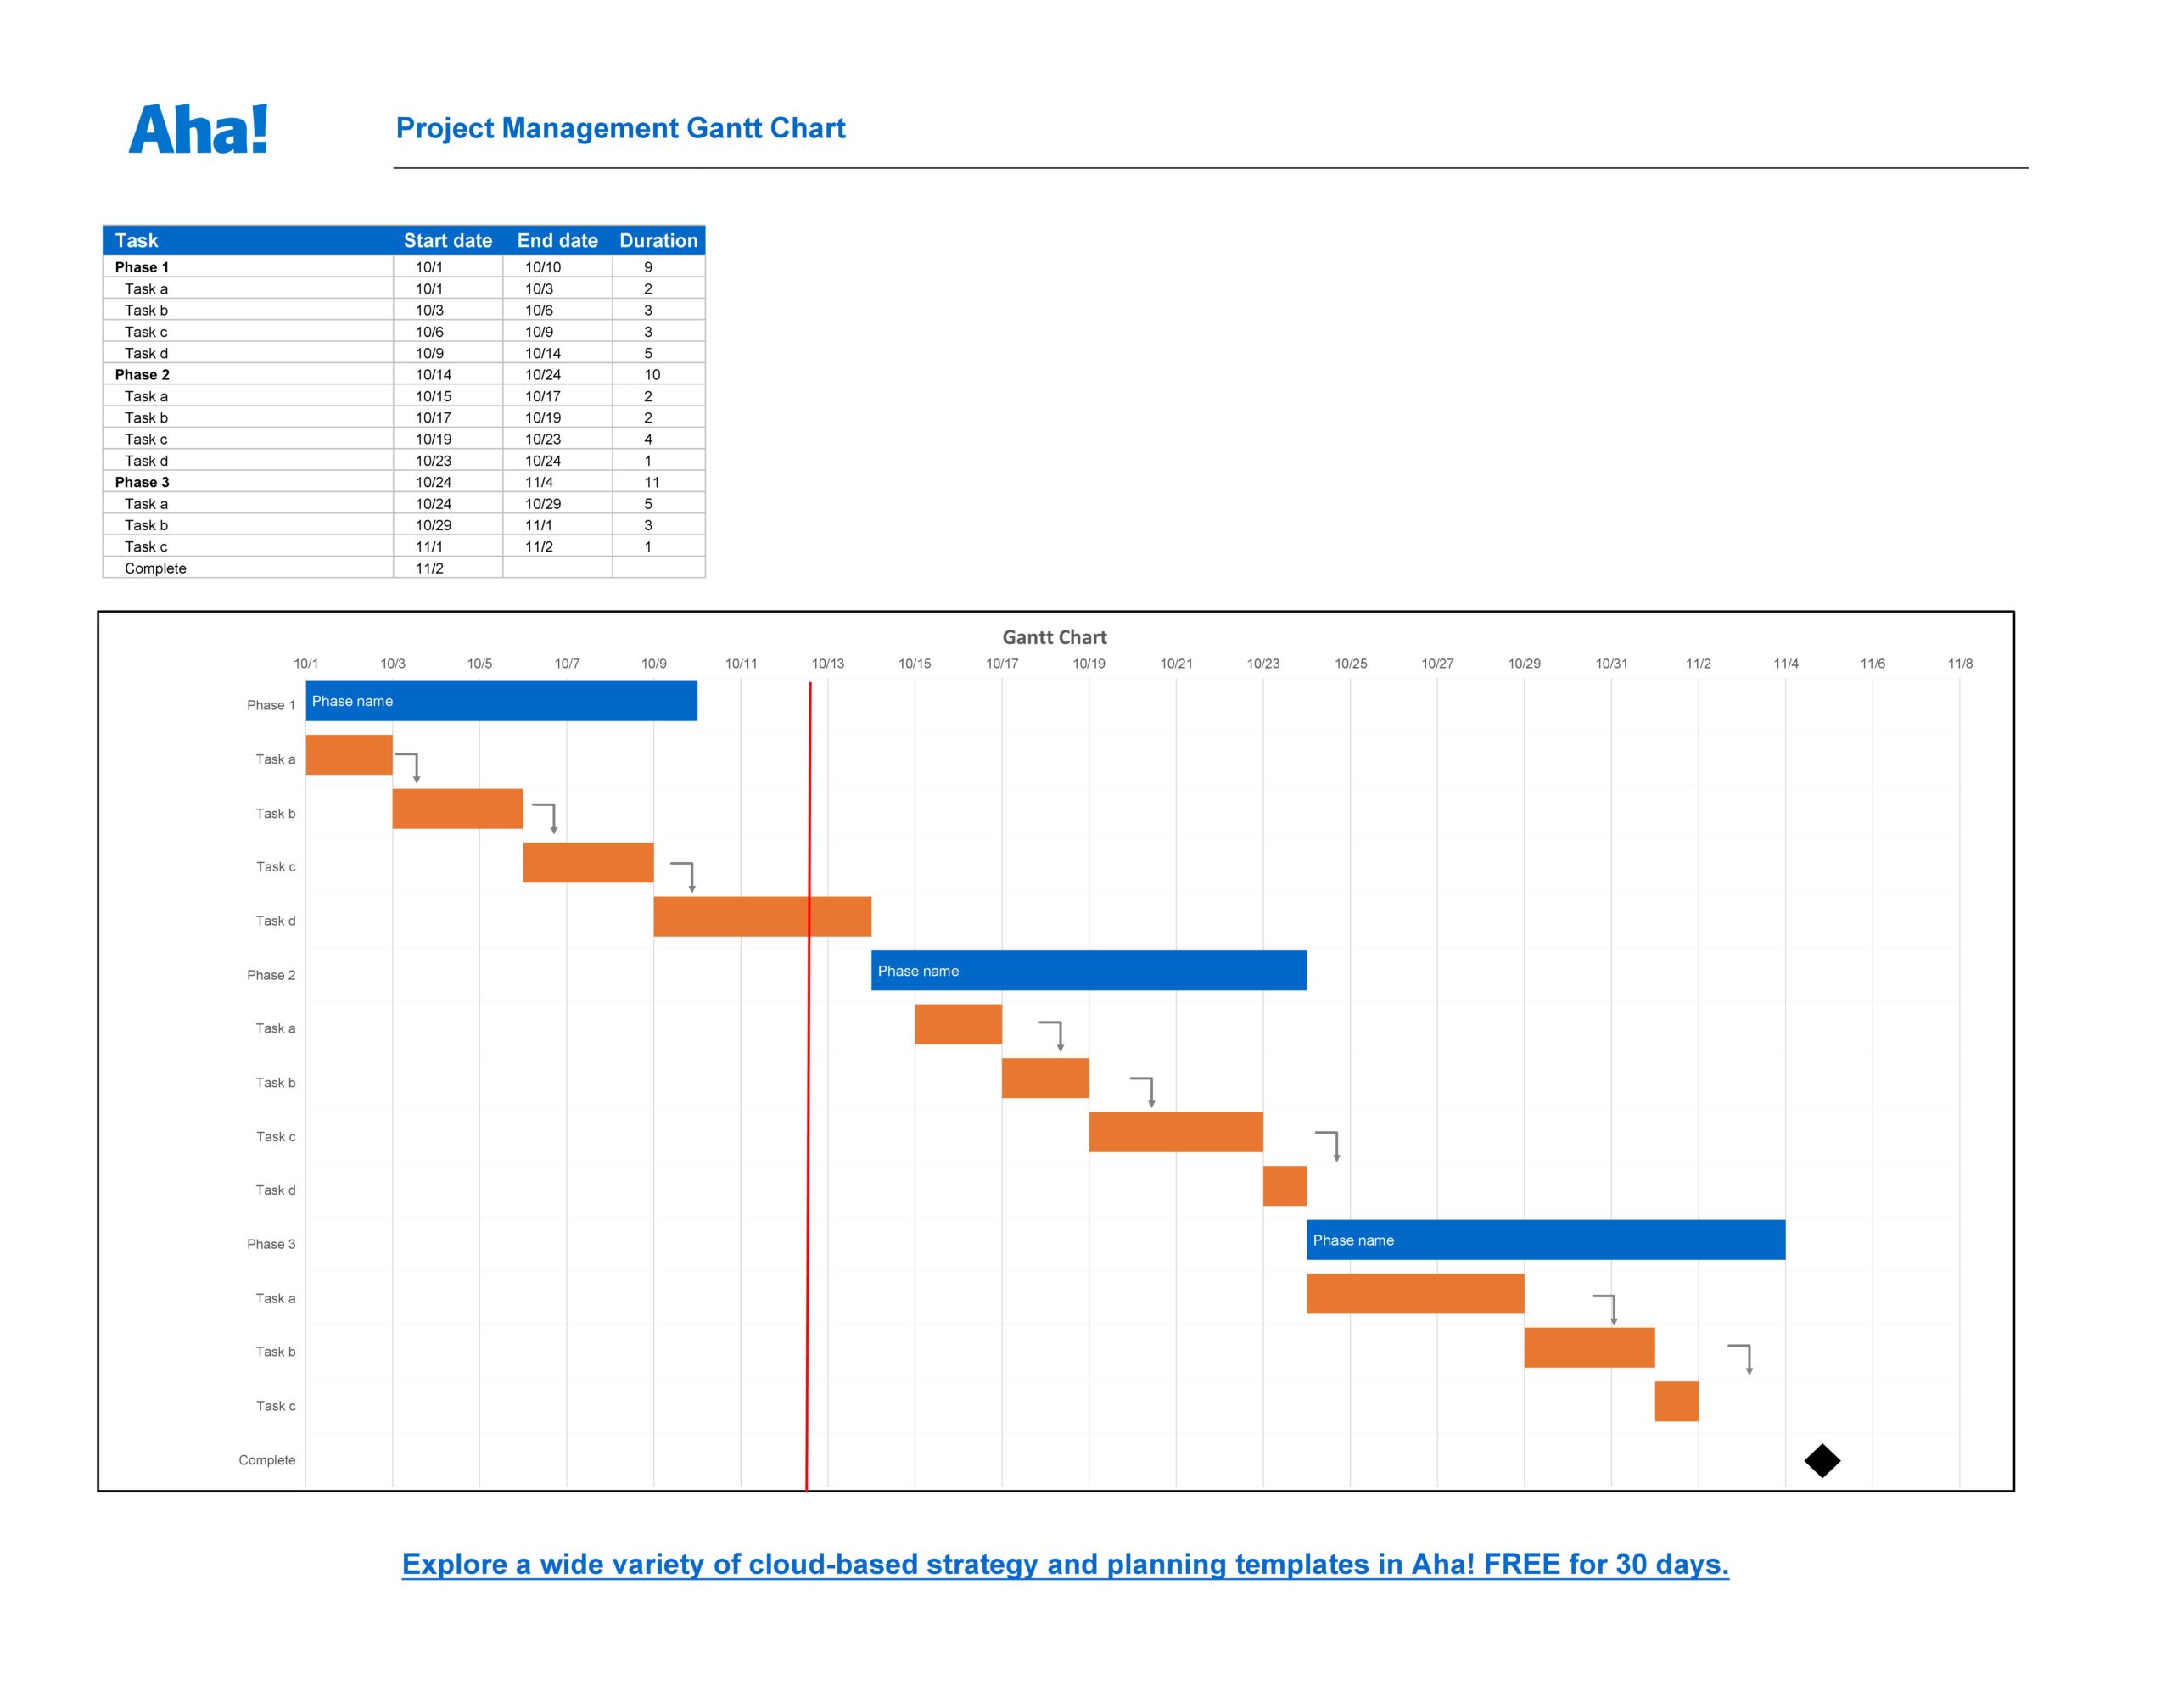
Under normal situations, project plans require you to perform tasks in a certain order. For example, in the case of a publication. You must write and proofread a book first before you can send it for printing. To do this using a Gantt application, you need to link the tasks to make them dependent on each other.
Tasks are typically linked to each other in some sort of a “Start to Finish” relationship. This simply means that the first task you choose must get accomplished before starting with the next task. In a Gantt chart template, this is usually indicated by lines that have arrowheads connecting each task to one another.
How to manage projects using a Gantt chart?
As earlier mentioned, the Gantt chart is a very useful tool in planning and executing projects. You can make a Gantt chart Excel template by either using the traditional way or through the use of software programs. Here are some pointers to manage projects using a Gantt chart Excel:
- Come up with a work breakdown structure
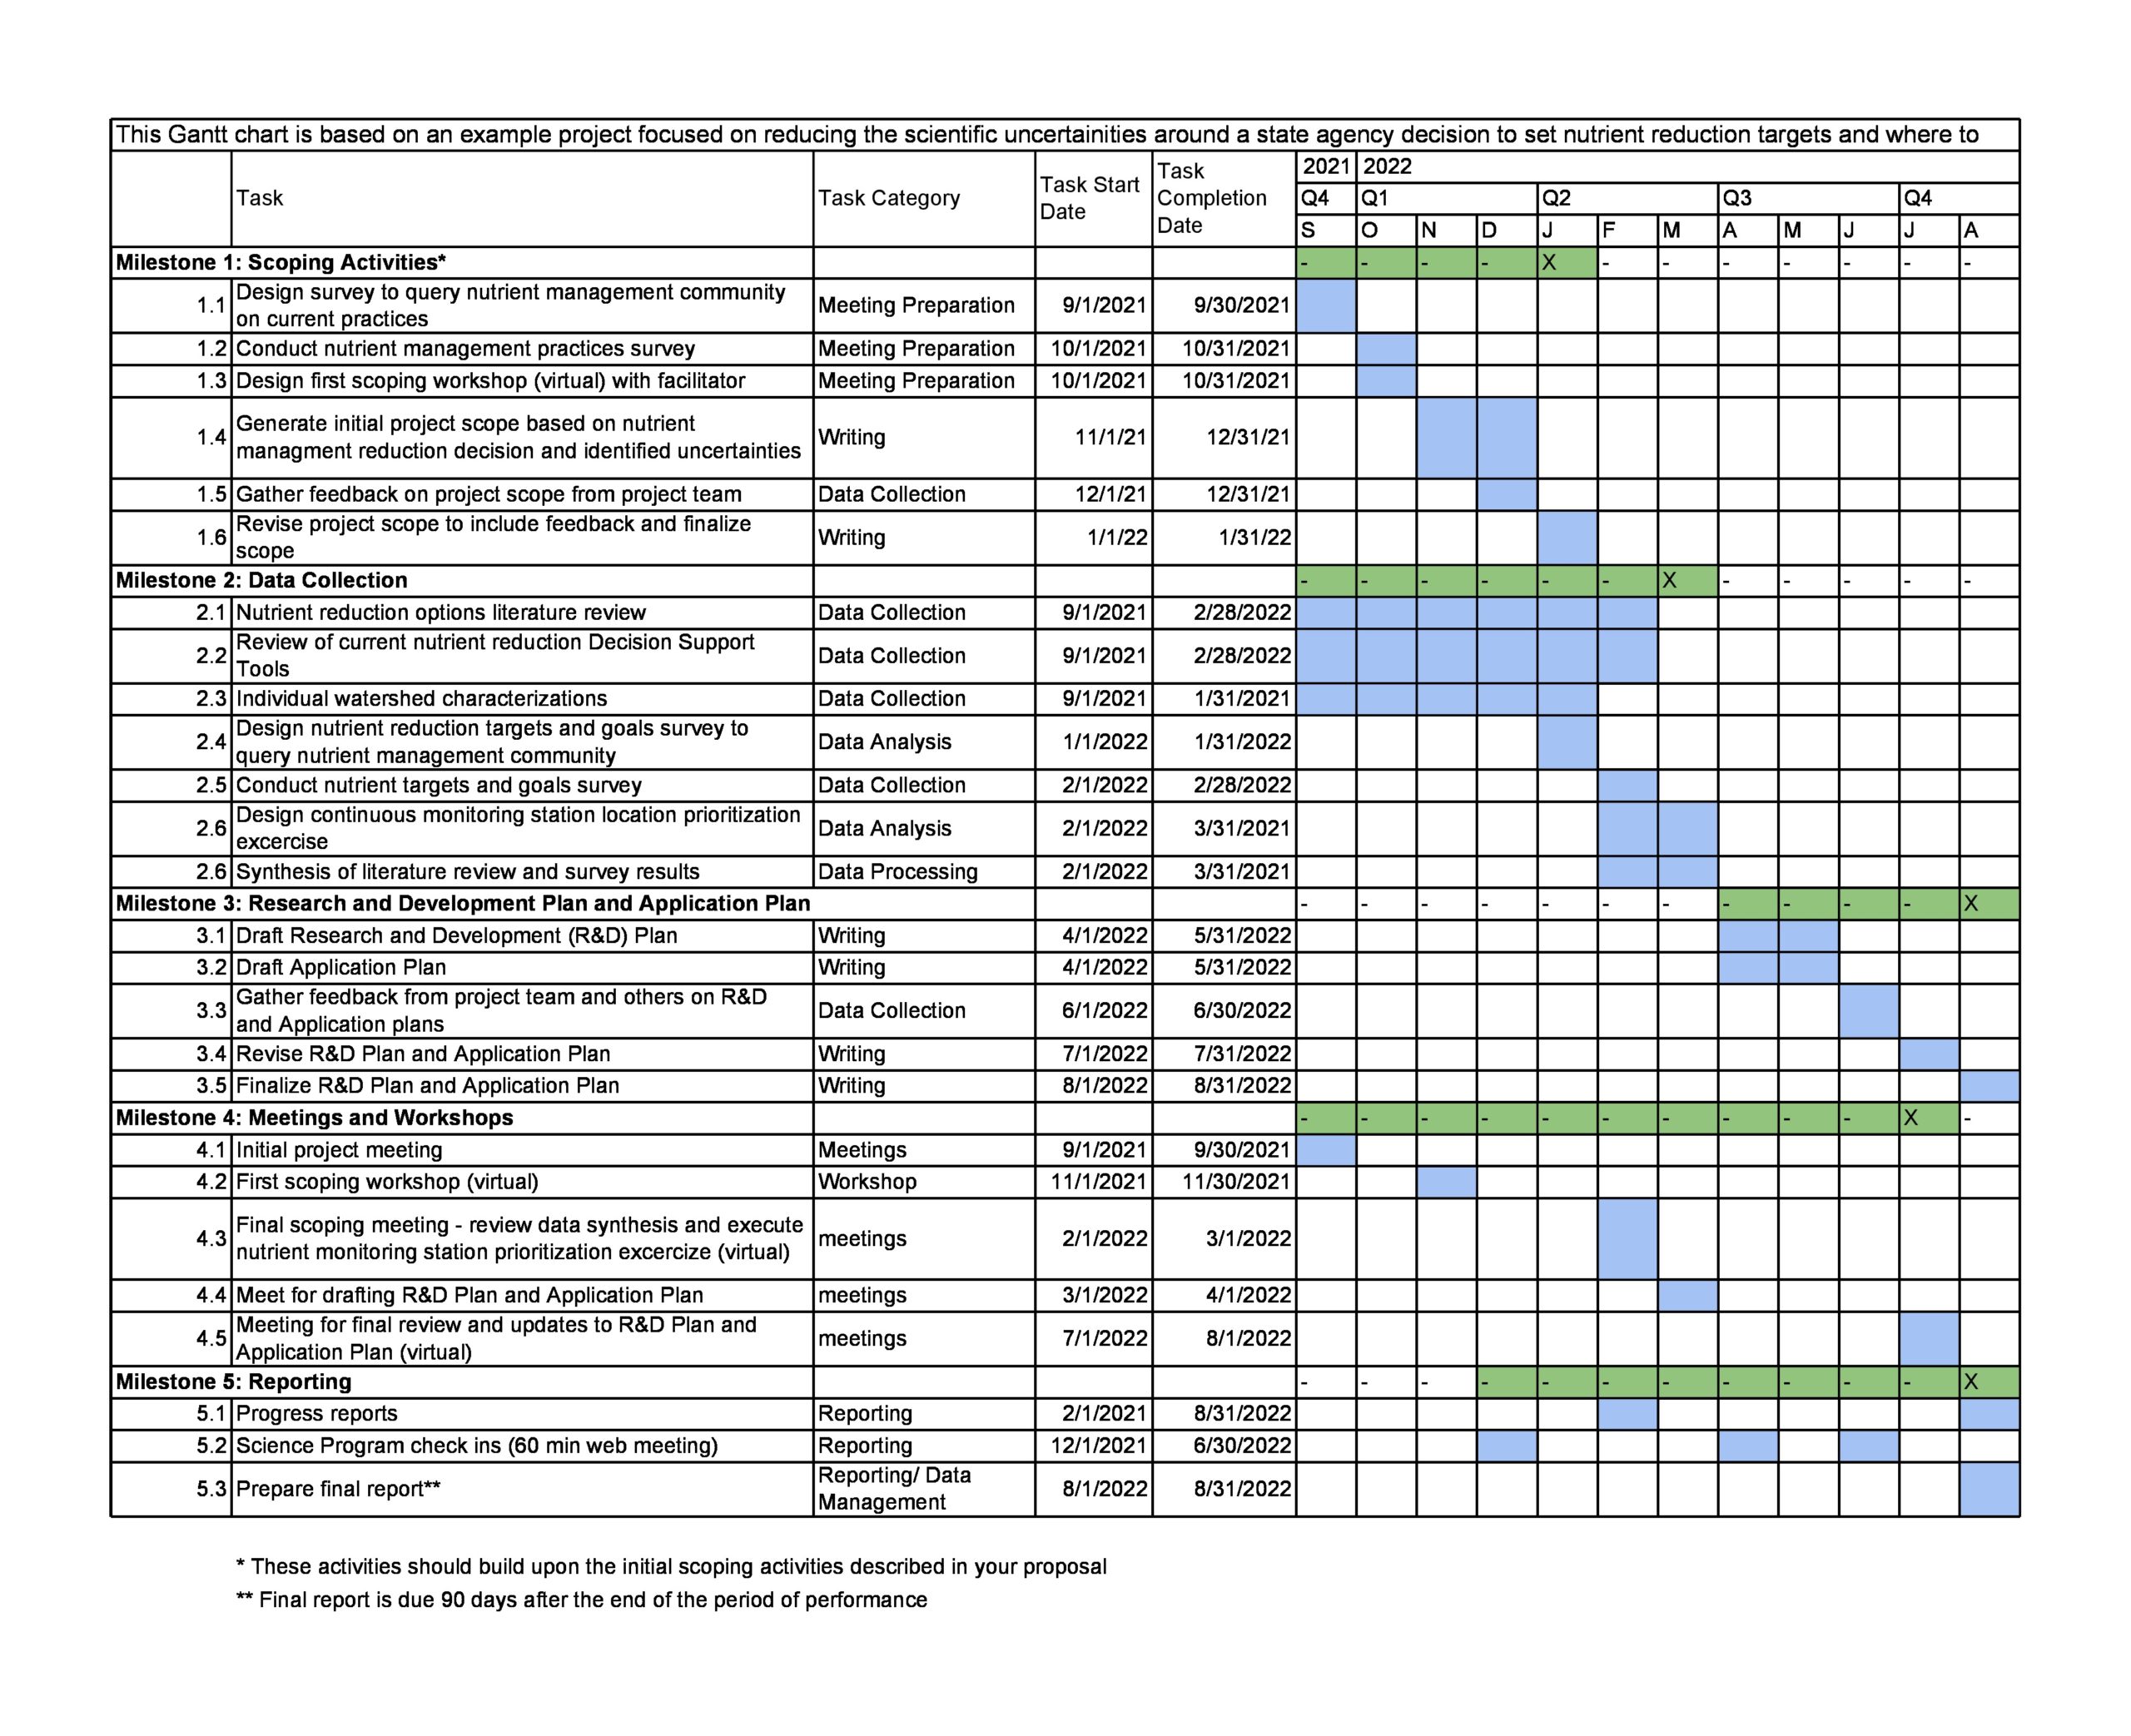
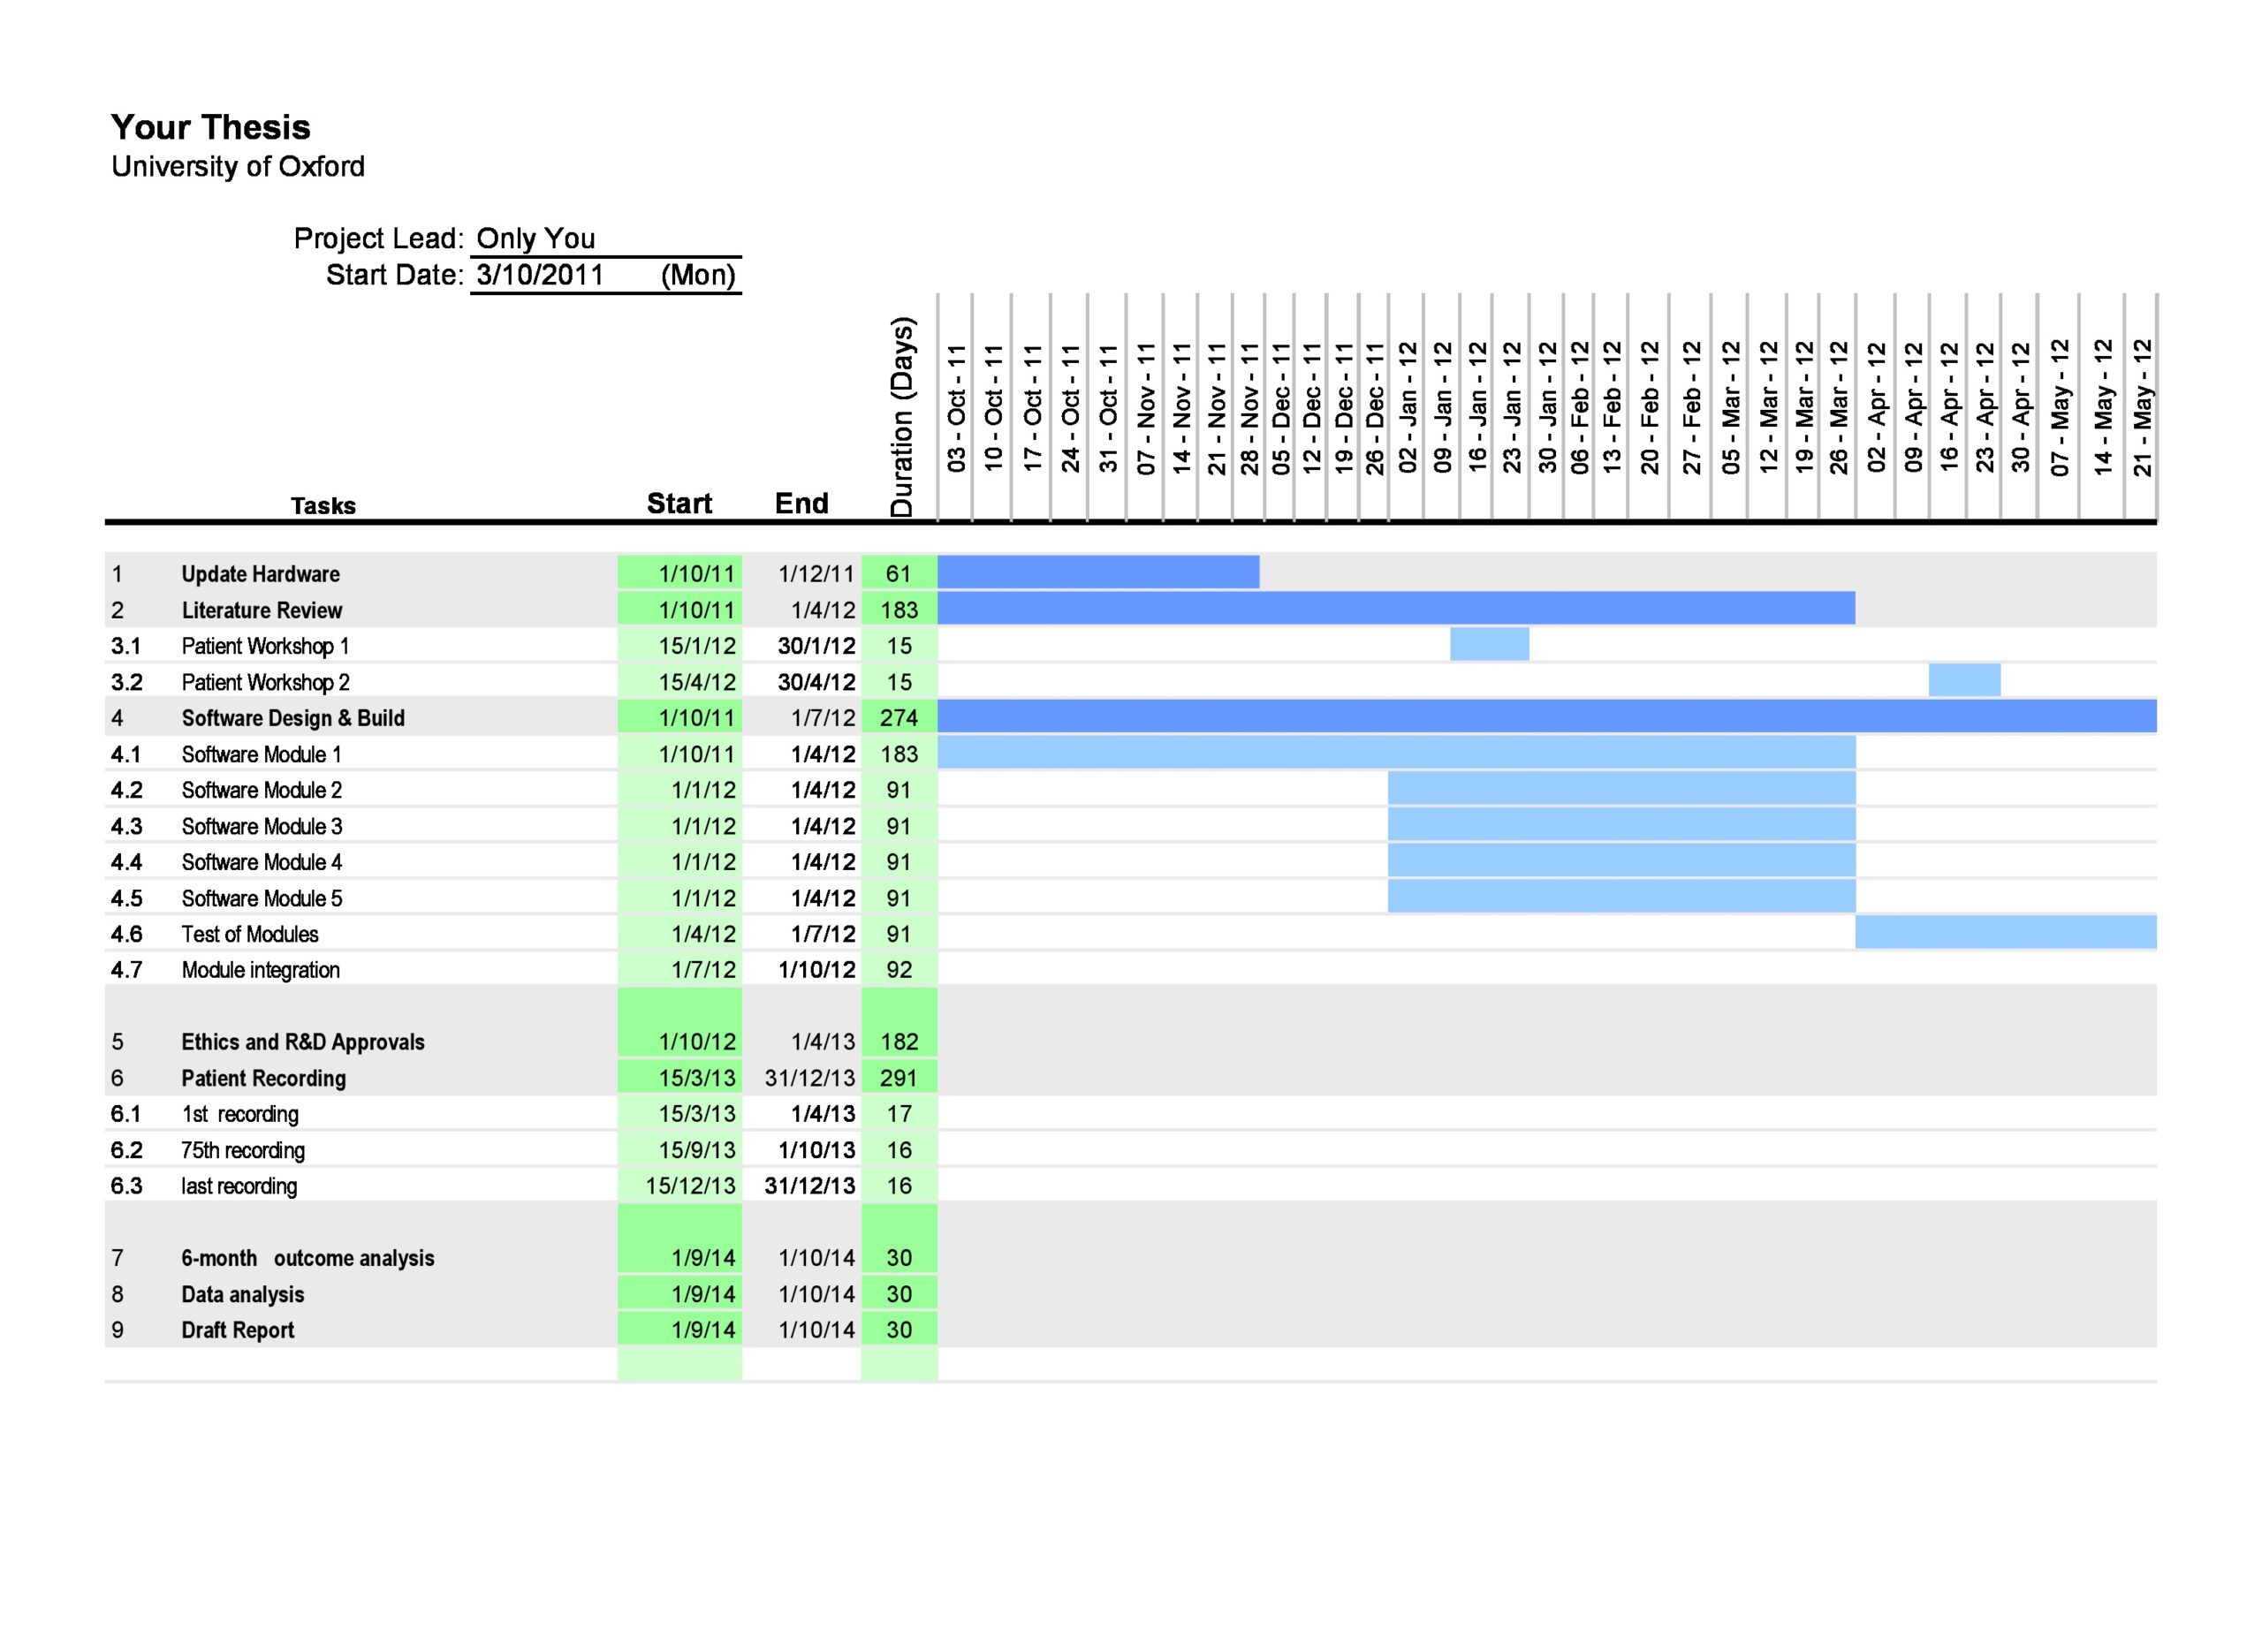
This is the process where you break the project down into more understandable and definable goals, tasks or milestones. First, list the project’s basic components to develop the Work Breakdown Structure (WBS). One important part of the WBS is the planning of intended outcomes instead of planning actions.
This means understanding your project’s goals and defining key milestones. From here, you begin the task of breaking down those pieces into smaller tasks. If the project has any fixed dates you need to meet, display these in the chart. Through this, you can easily discern whether there’s a need to add more resources to meet specific deadlines.
After determining the most important topics, breaking them down into tasks comes next. Depending on how complex a task is, you might need to keep on breaking down these tasks into sub-tasks until you get tasks which are extremely specific. - Assign tasks
When building your chart, one of the most relevant pieces of information is how you distribute the tasks among those involved in the project. Here are some things that you must consider in terms of this issue:
Who are the people most fit to accomplish the most important tasks of the project?
Are these people available and what’s their current scheduled workload?
What’s a reasonable estimation of the time these people need to accomplish the tasks?
Will there be a need for additional resources or people to get the tasks accomplished on time? - Evaluate the dependencies of tasks
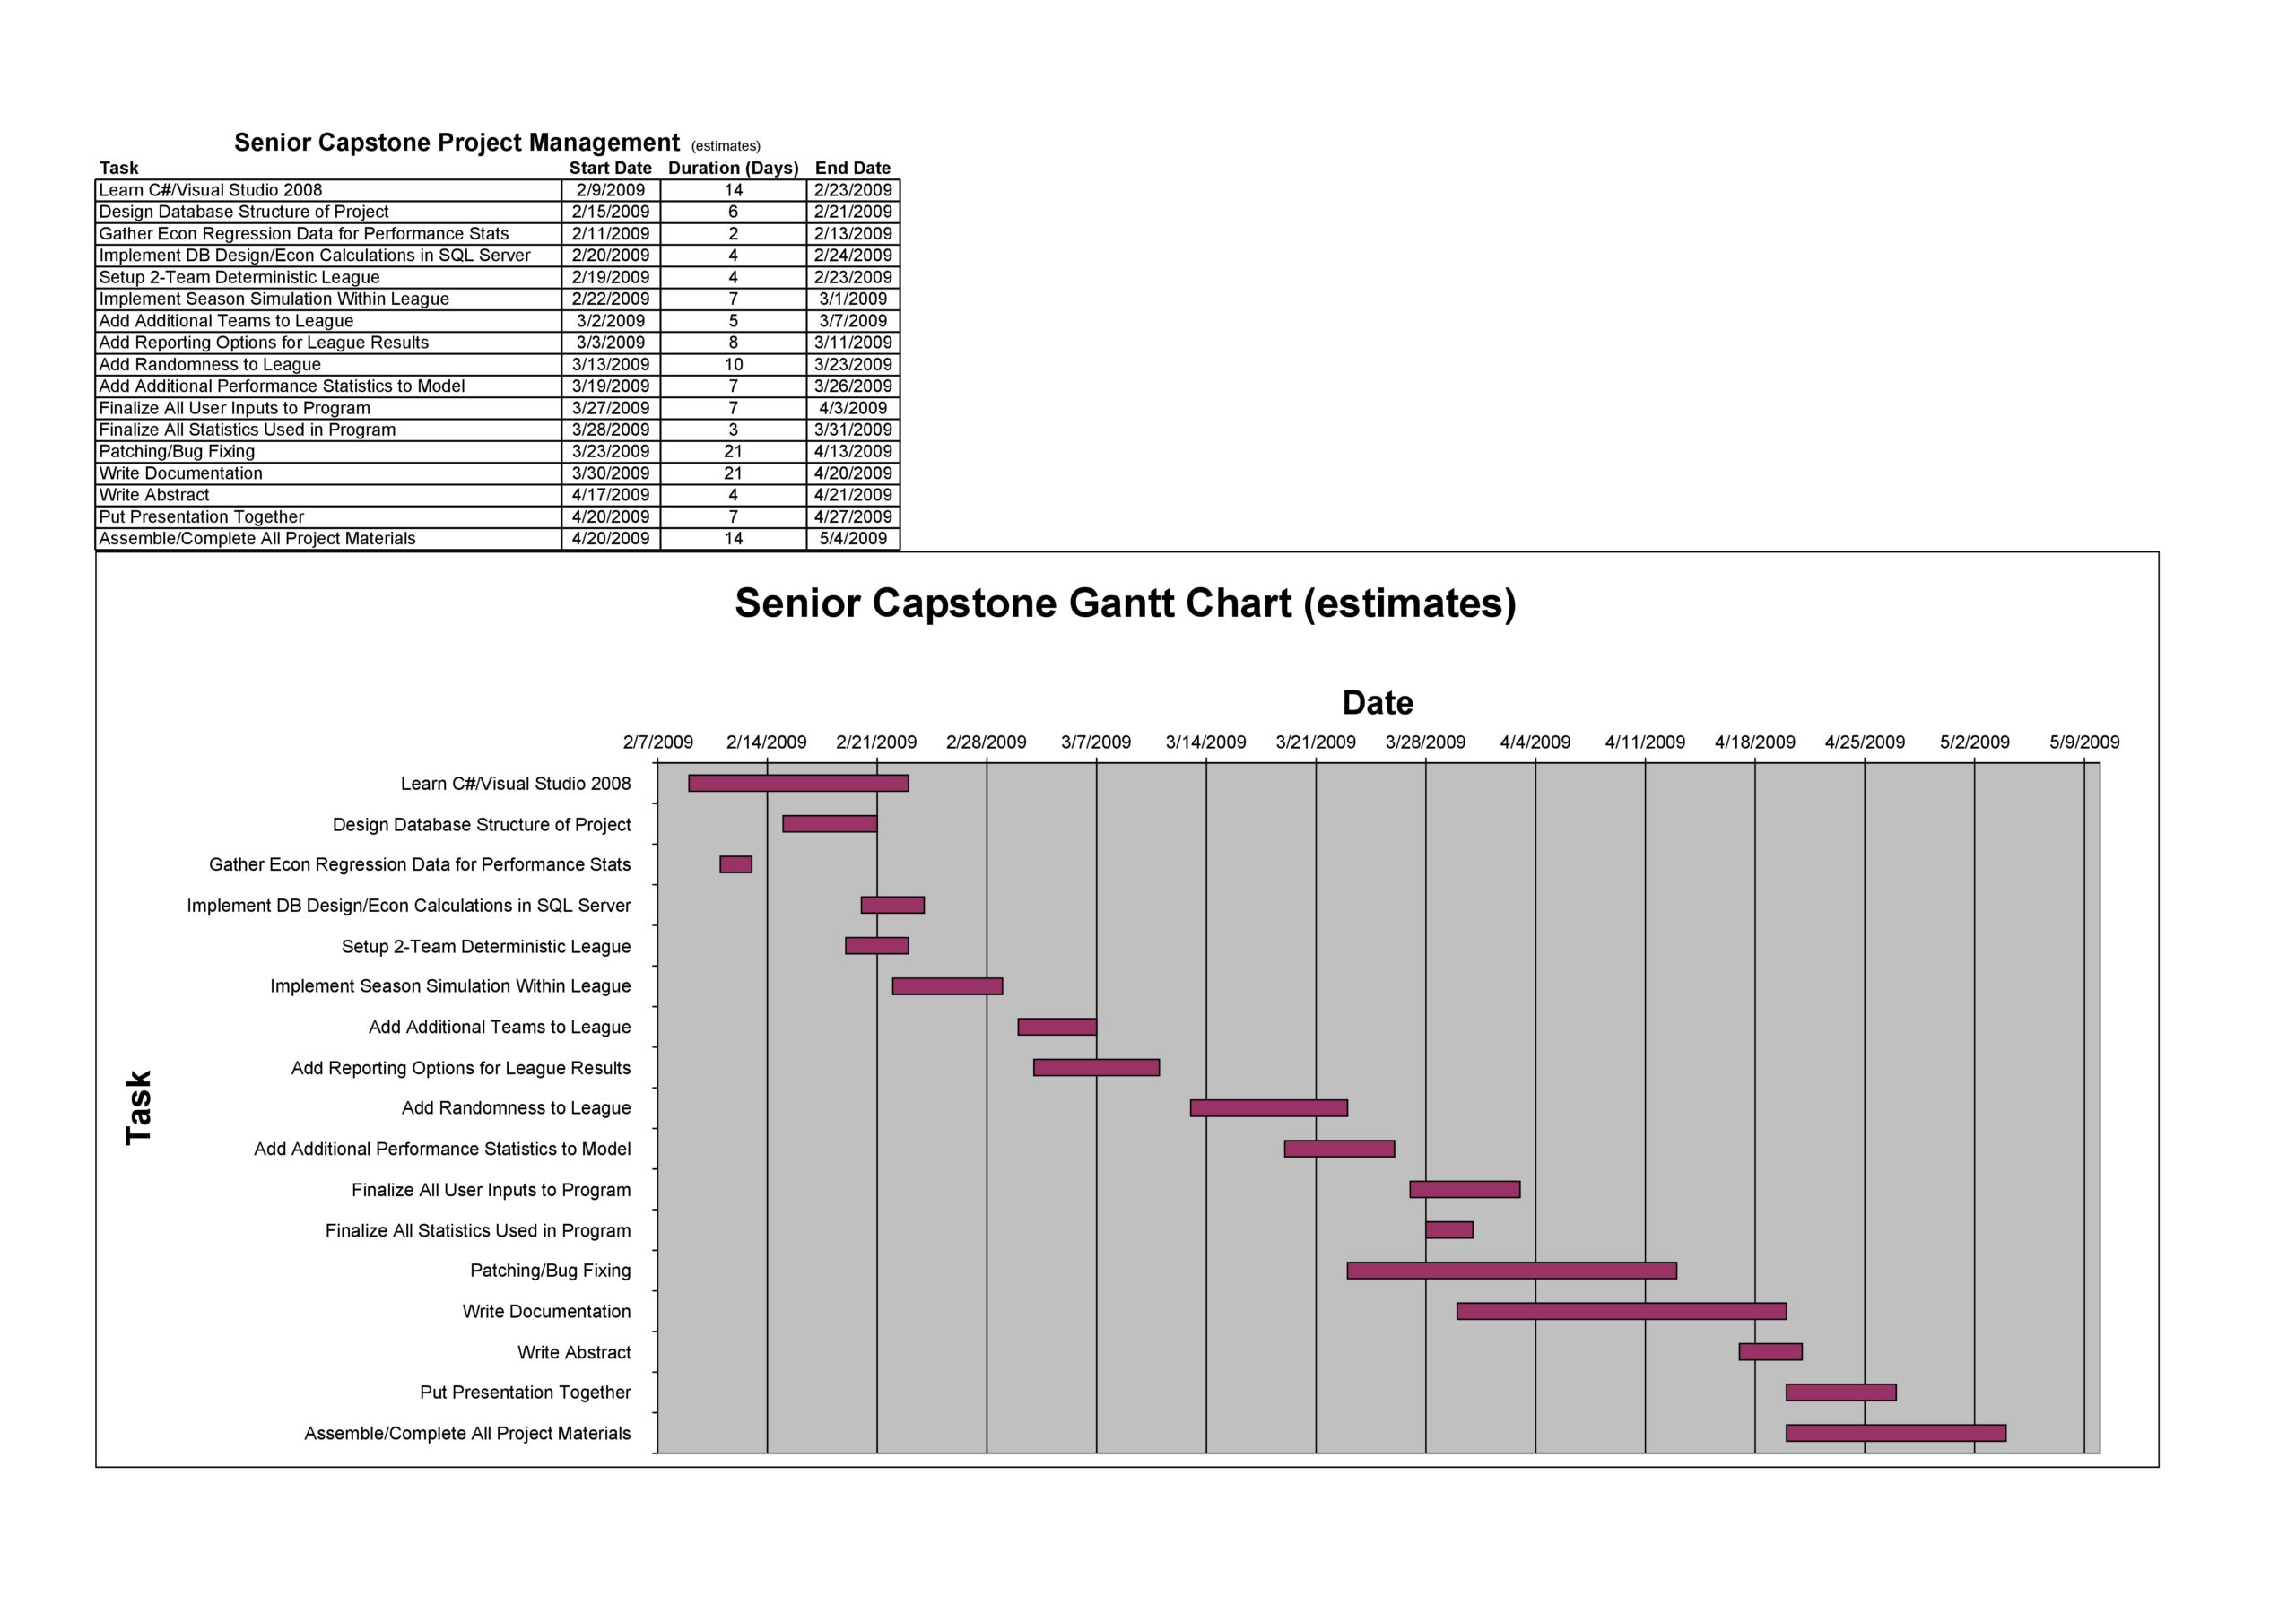
One great feature of a Gantt chart used in project management is that the chart makes it a lot easier for you to see the dependencies between tasks. This involves a situation where one of the tasks depends on the outcome or completion of another. Using automated software enables you to include dependencies while you create the chart.
However, if you plan to create your chart by hand or by using an application that’s less sophisticated, you must remember doing this important step manually. - Share the chart with the rest of the team for evaluation
When you have finally completed your chart, distribute this to members of your team for feedback and review. There should be a concurrence among all team members that your plan will be completely effective, reasonable, and accurate.
It’s easier and simpler to plan extra resources, allow contingencies or propose a schedule with revisions during this stage instead of during a critical point when the plan is already in progress.
")
")
")