
Every day, the world continues to evolve as it tries to find more efficient methods for problem-solving and cause analysis when pursuing advancements. The fishbone diagram template is an excellent example of this method. You use it to track down the reasons for variations, defects, failures or imperfections.
Contents
Fishbone Diagram Templates


What is a fishbone diagram?
Although the fishbone template has existed for quite some time now, it is still an effective tool that allows the quick discovery of root causes when trying to find corrective actions.
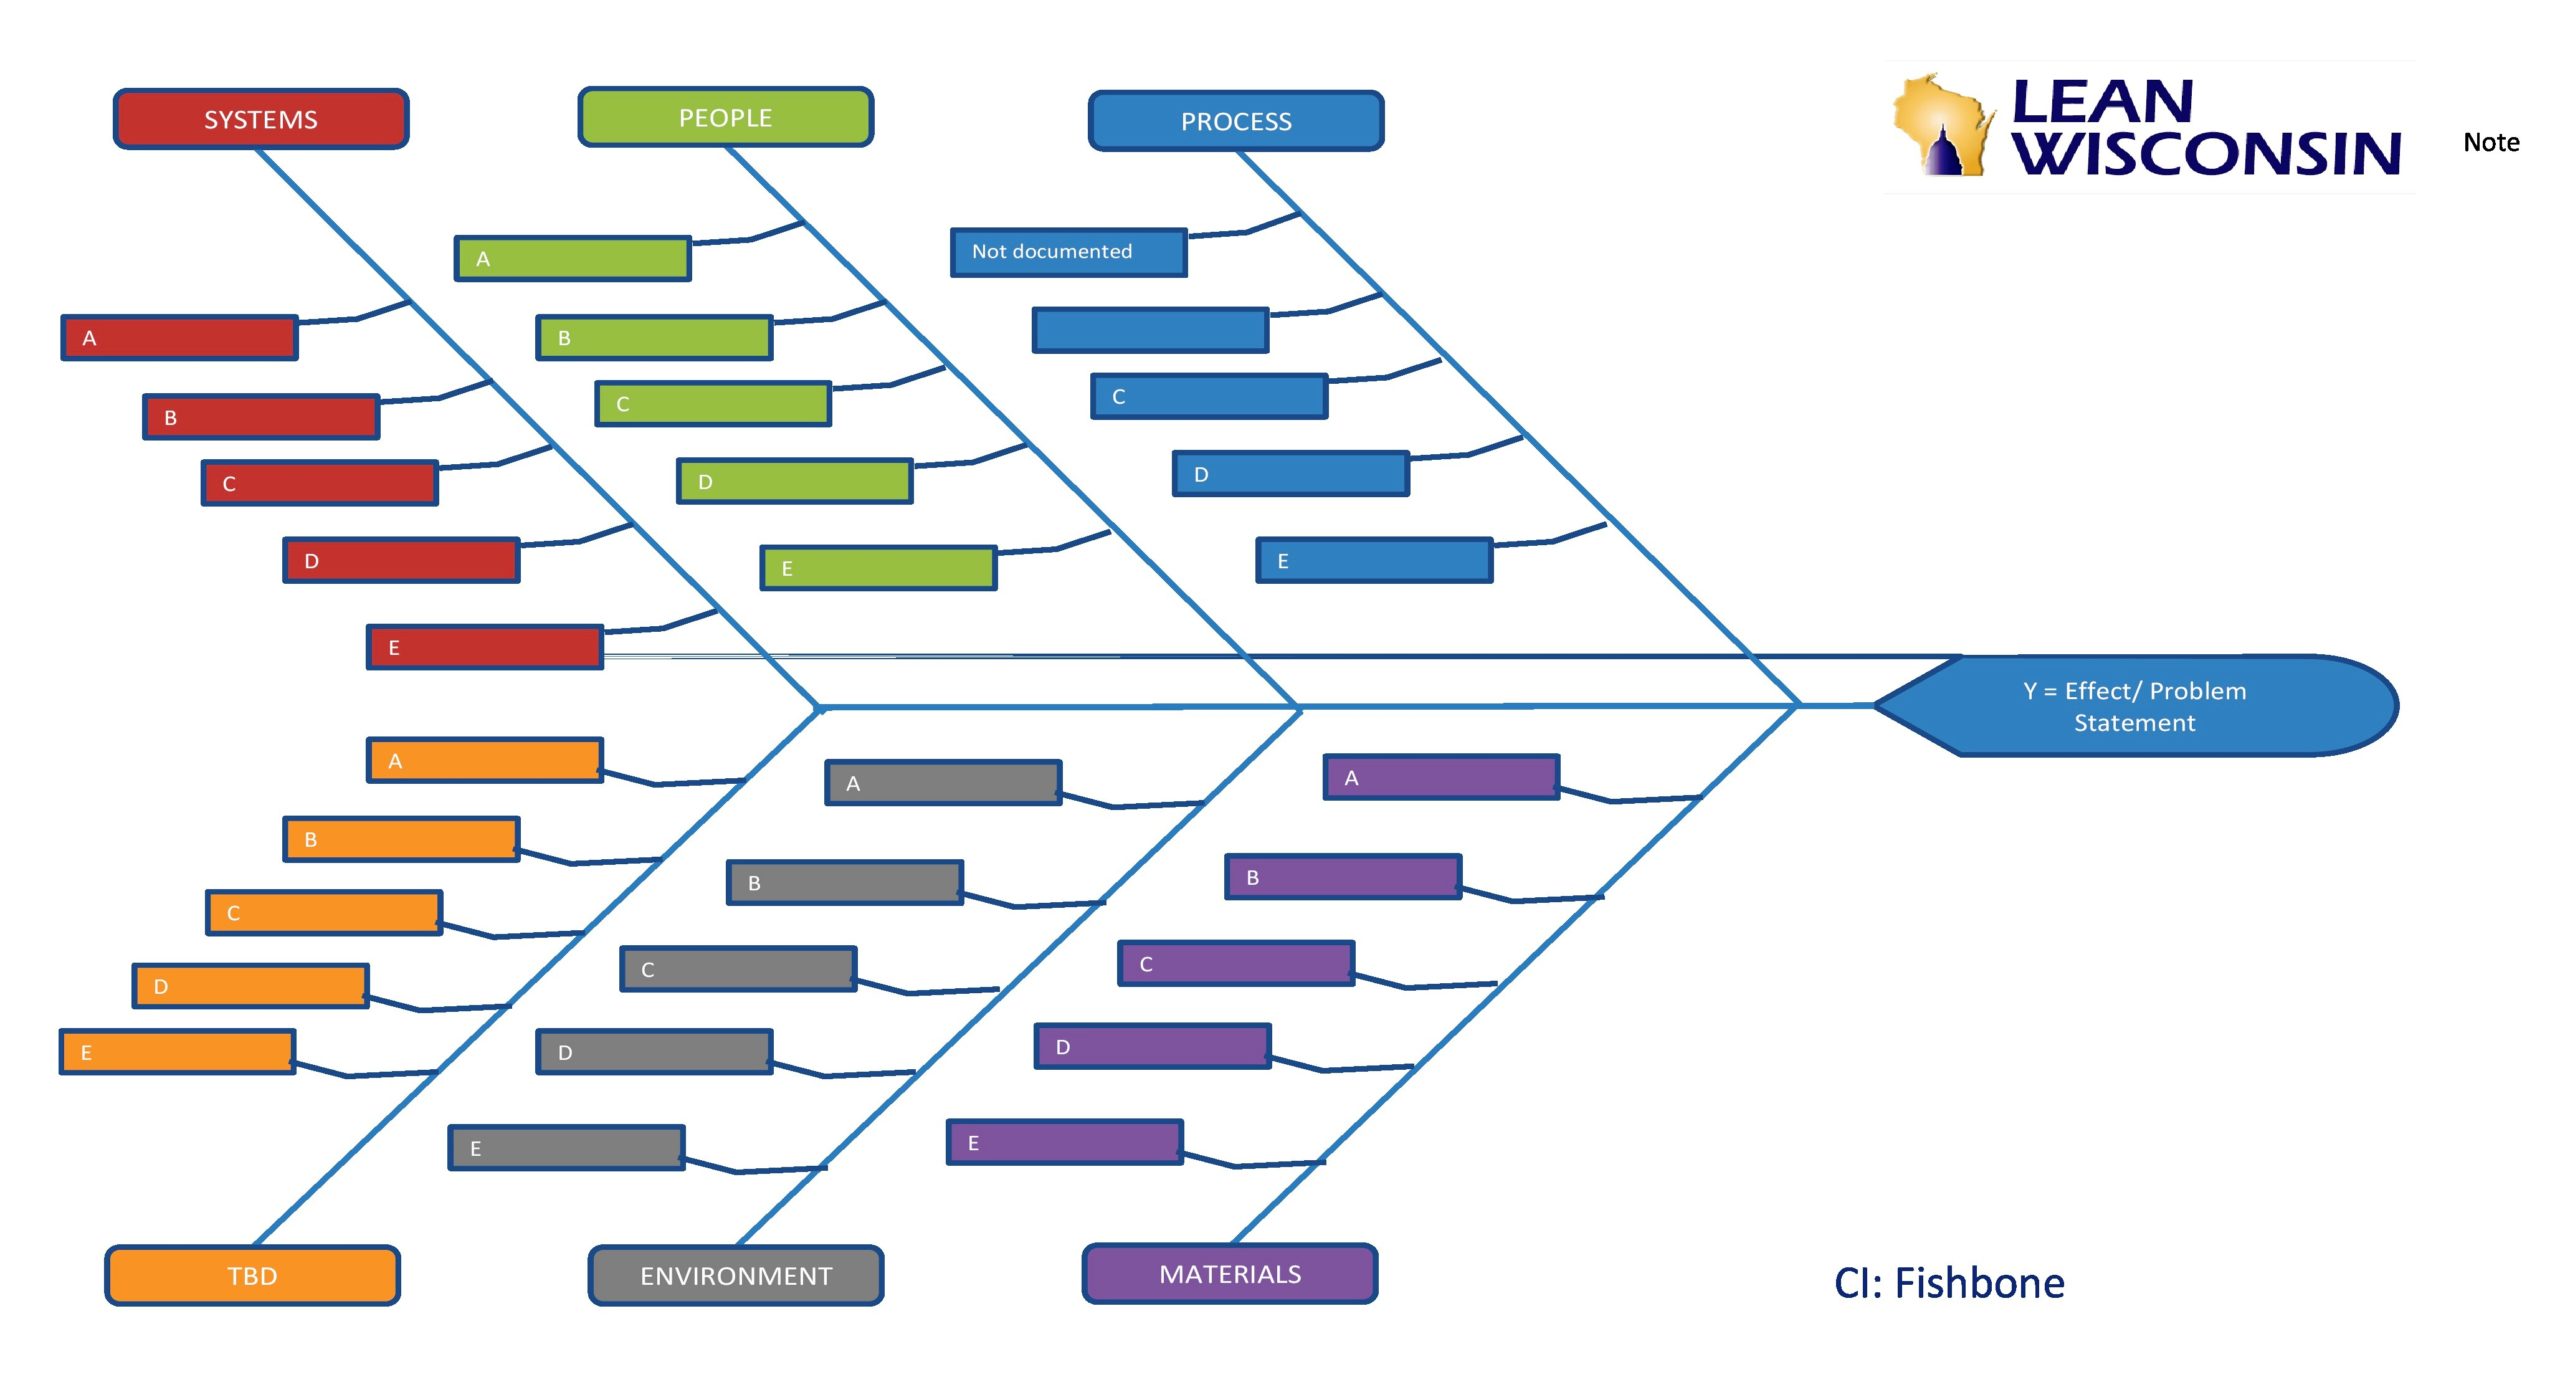
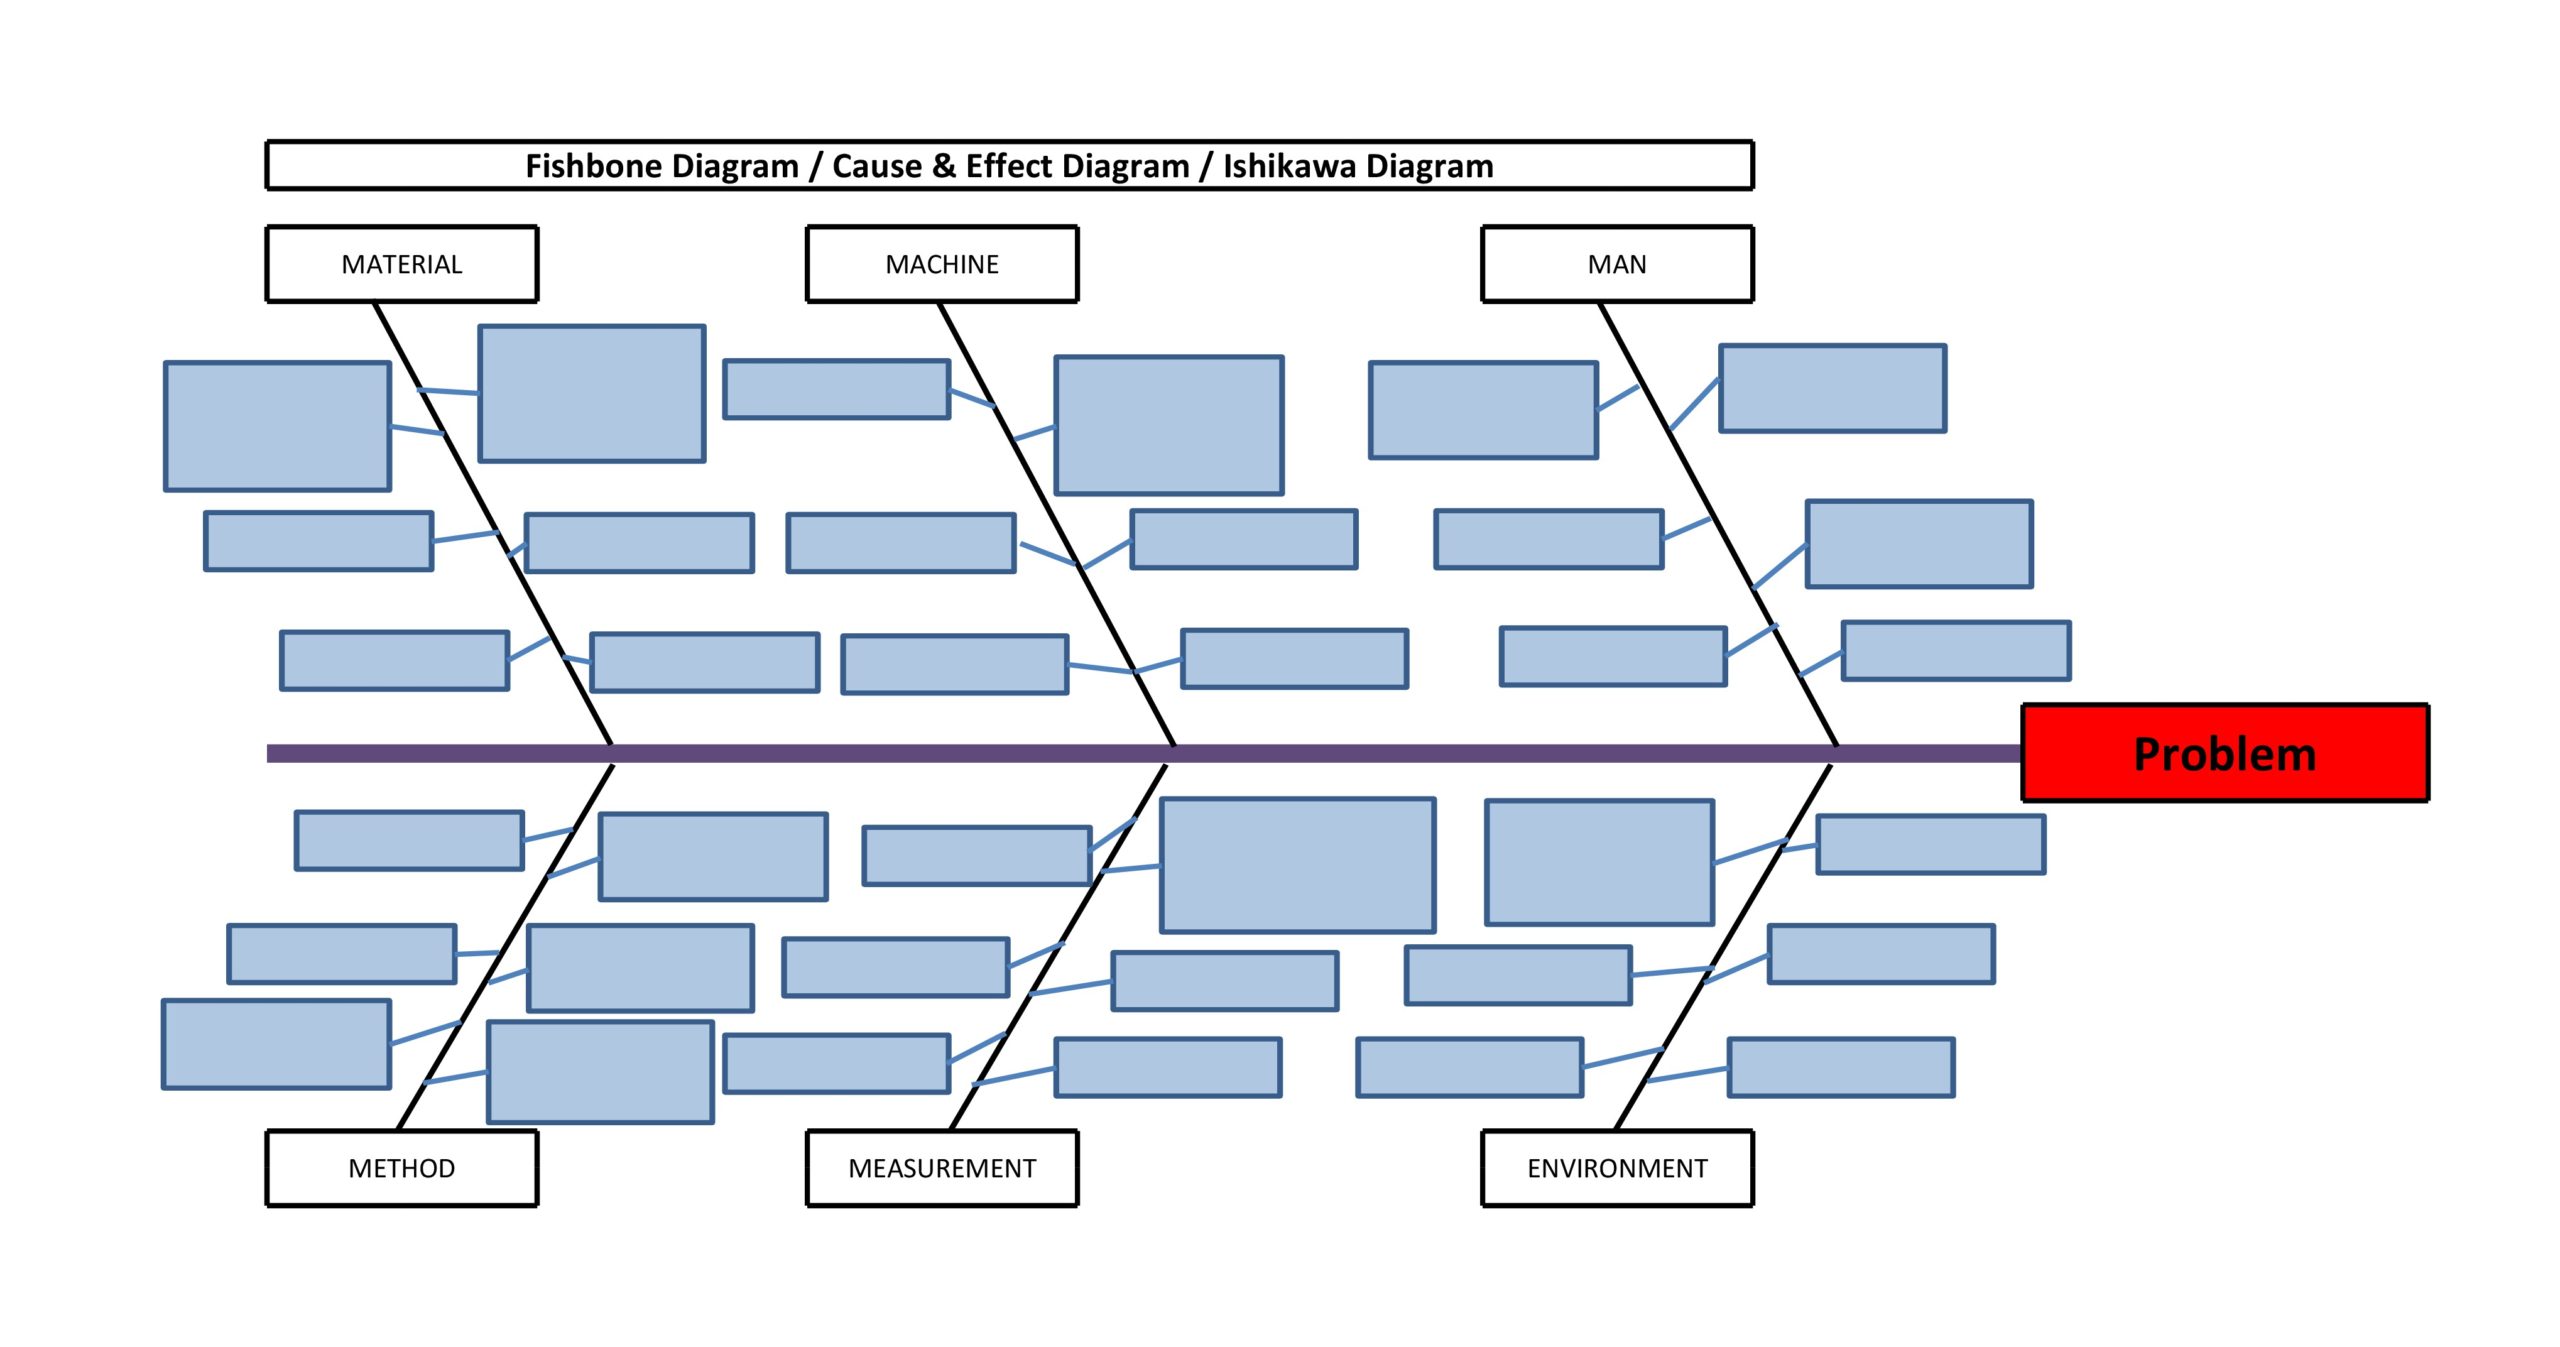
Also known as the Ishikawa diagram or the cause and effect diagram, the fishbone diagram template is a simple but popular tool used for thinking about issues and causes of problems.
The main purpose of the diagram is to think about all of the probable causes that can bring about difficulties in a certain issue then dig deep within the factors causing the issue. Once you have identified the problem, you can eliminate it.
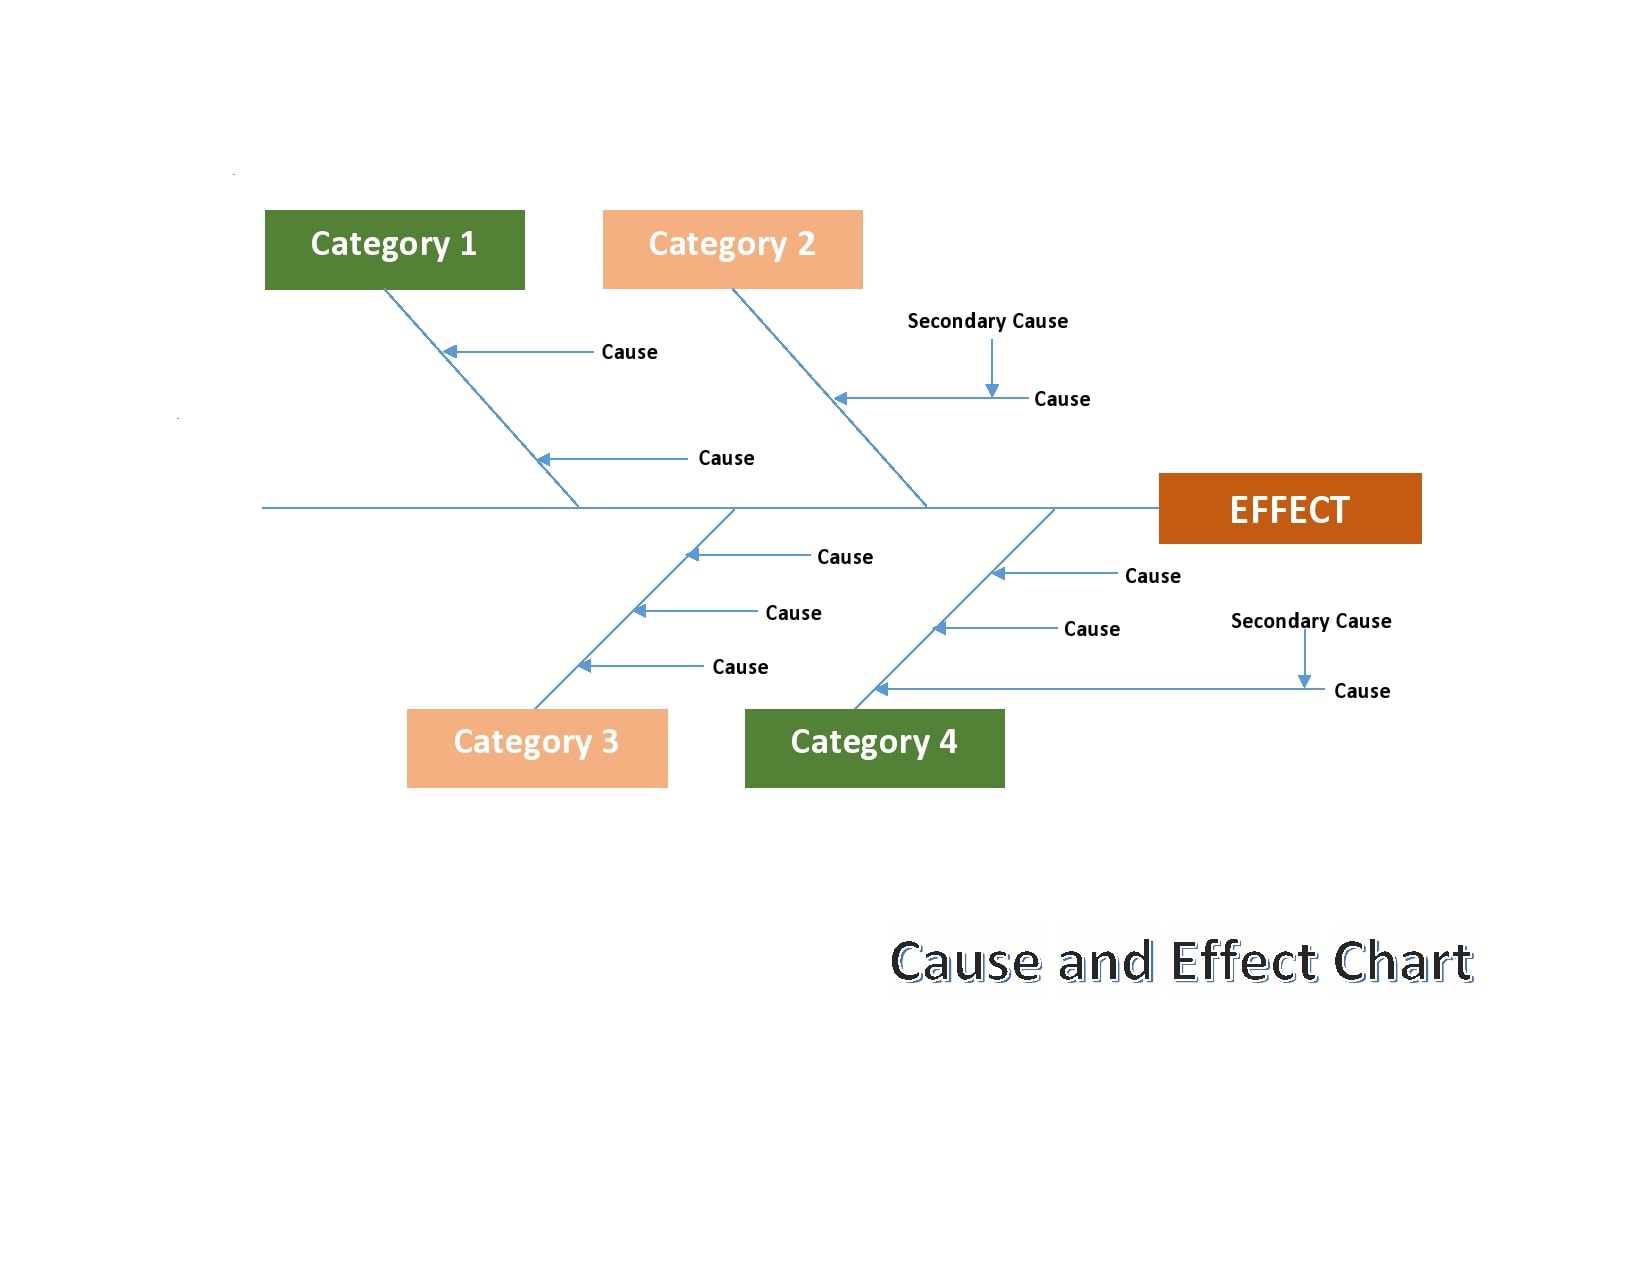
This enables you and your team to concentrate more on why the issue occurred in the first place. The diagram also allows you to focus on the history or symptoms of the issue. This way, you will see the real overview of your team’s collective inputs. In general, the diagram which involves two causes:
- The primary cause that can lead to the effect directly.
- The secondary cause that can lead to the primary cause but doesn’t have a direct effect on the final effect.
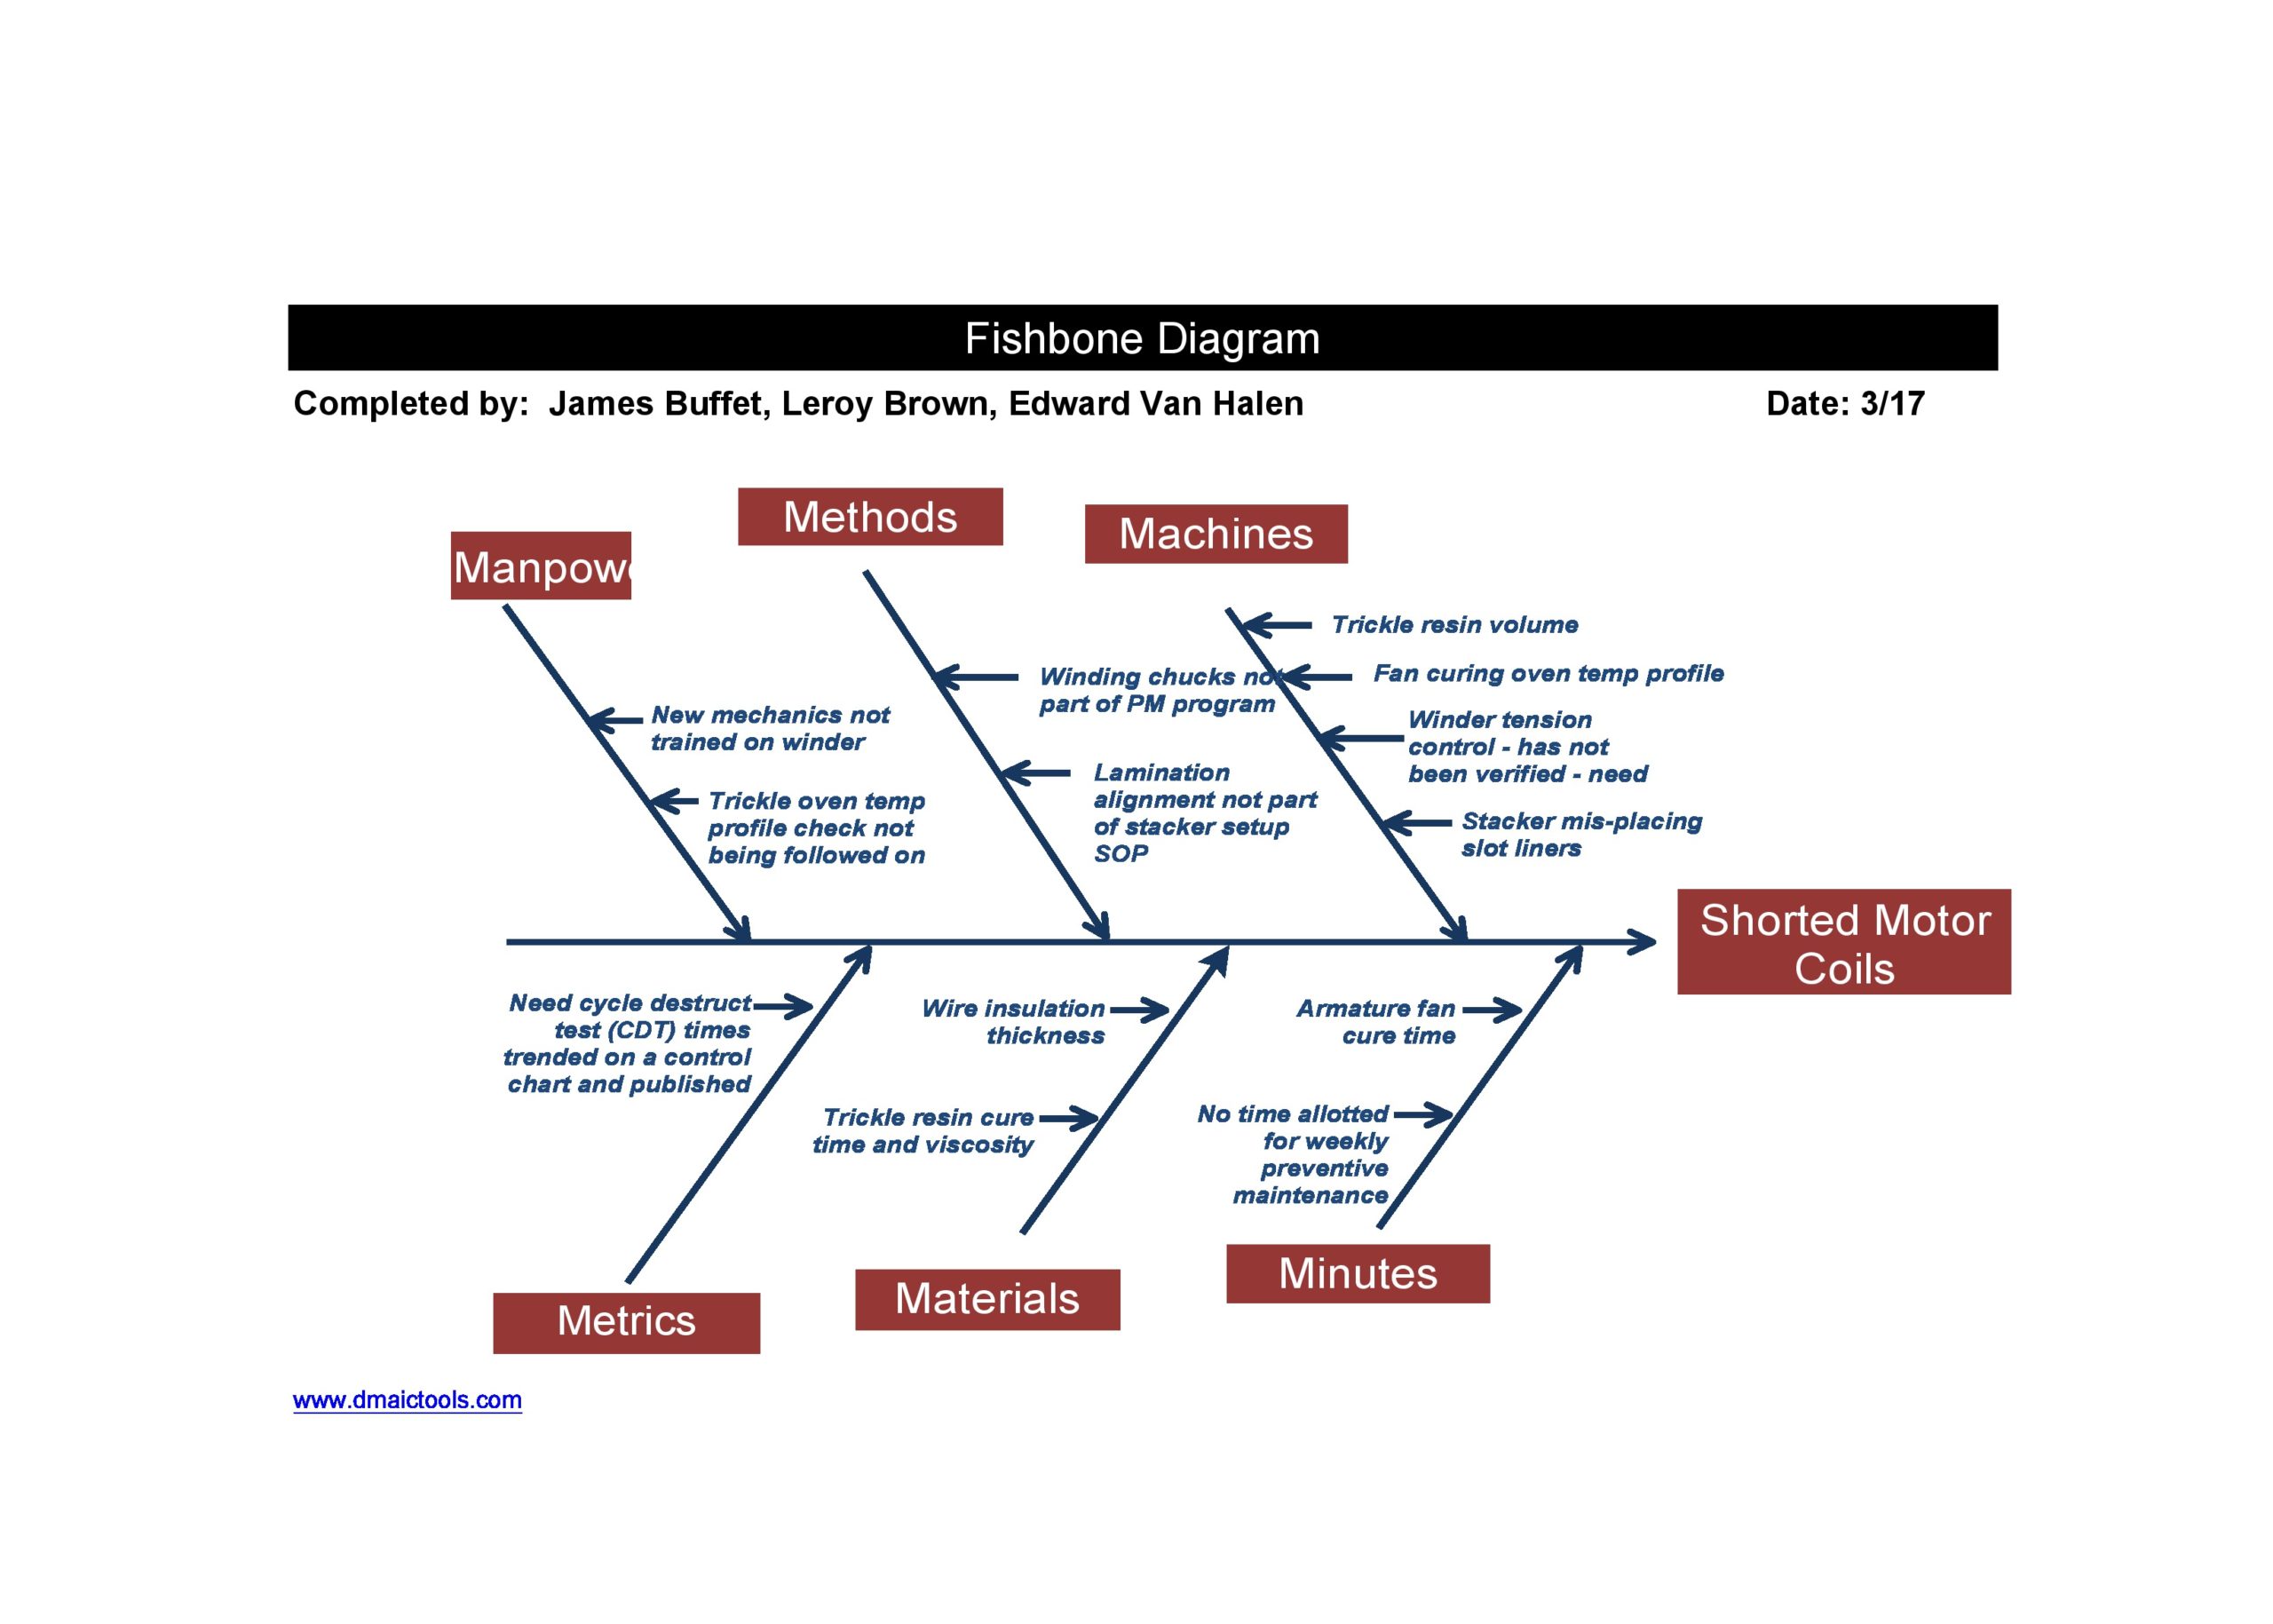
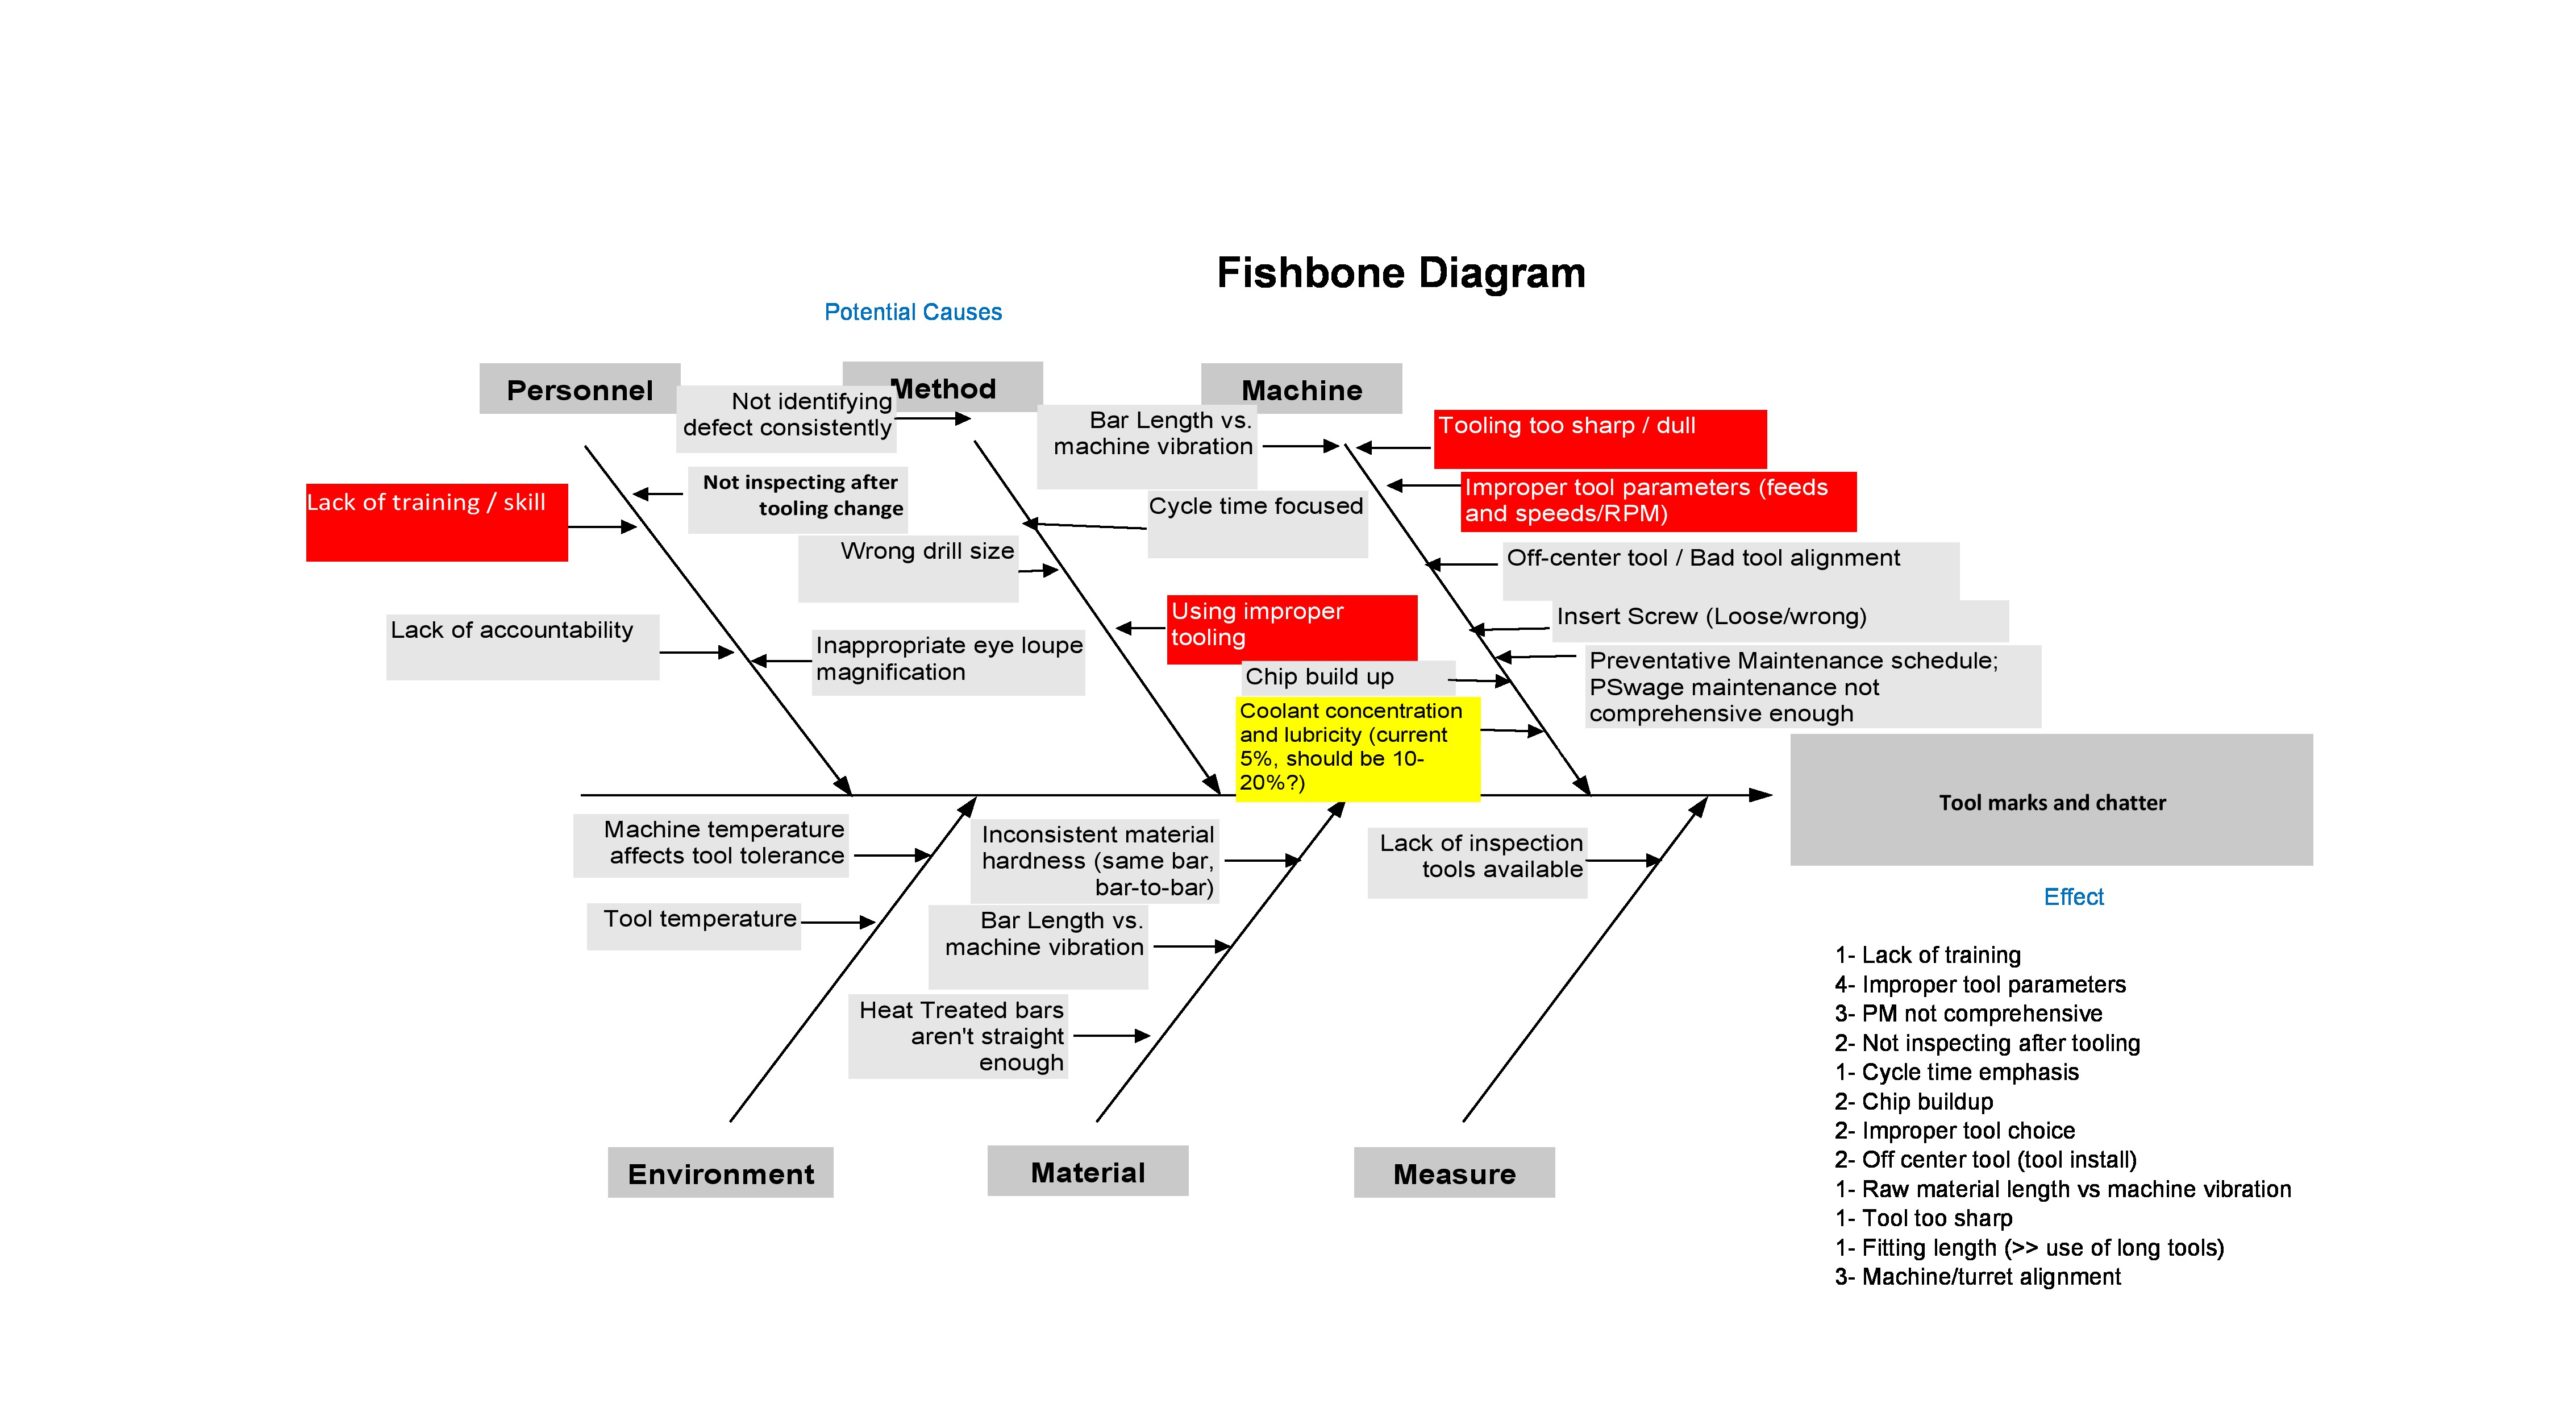
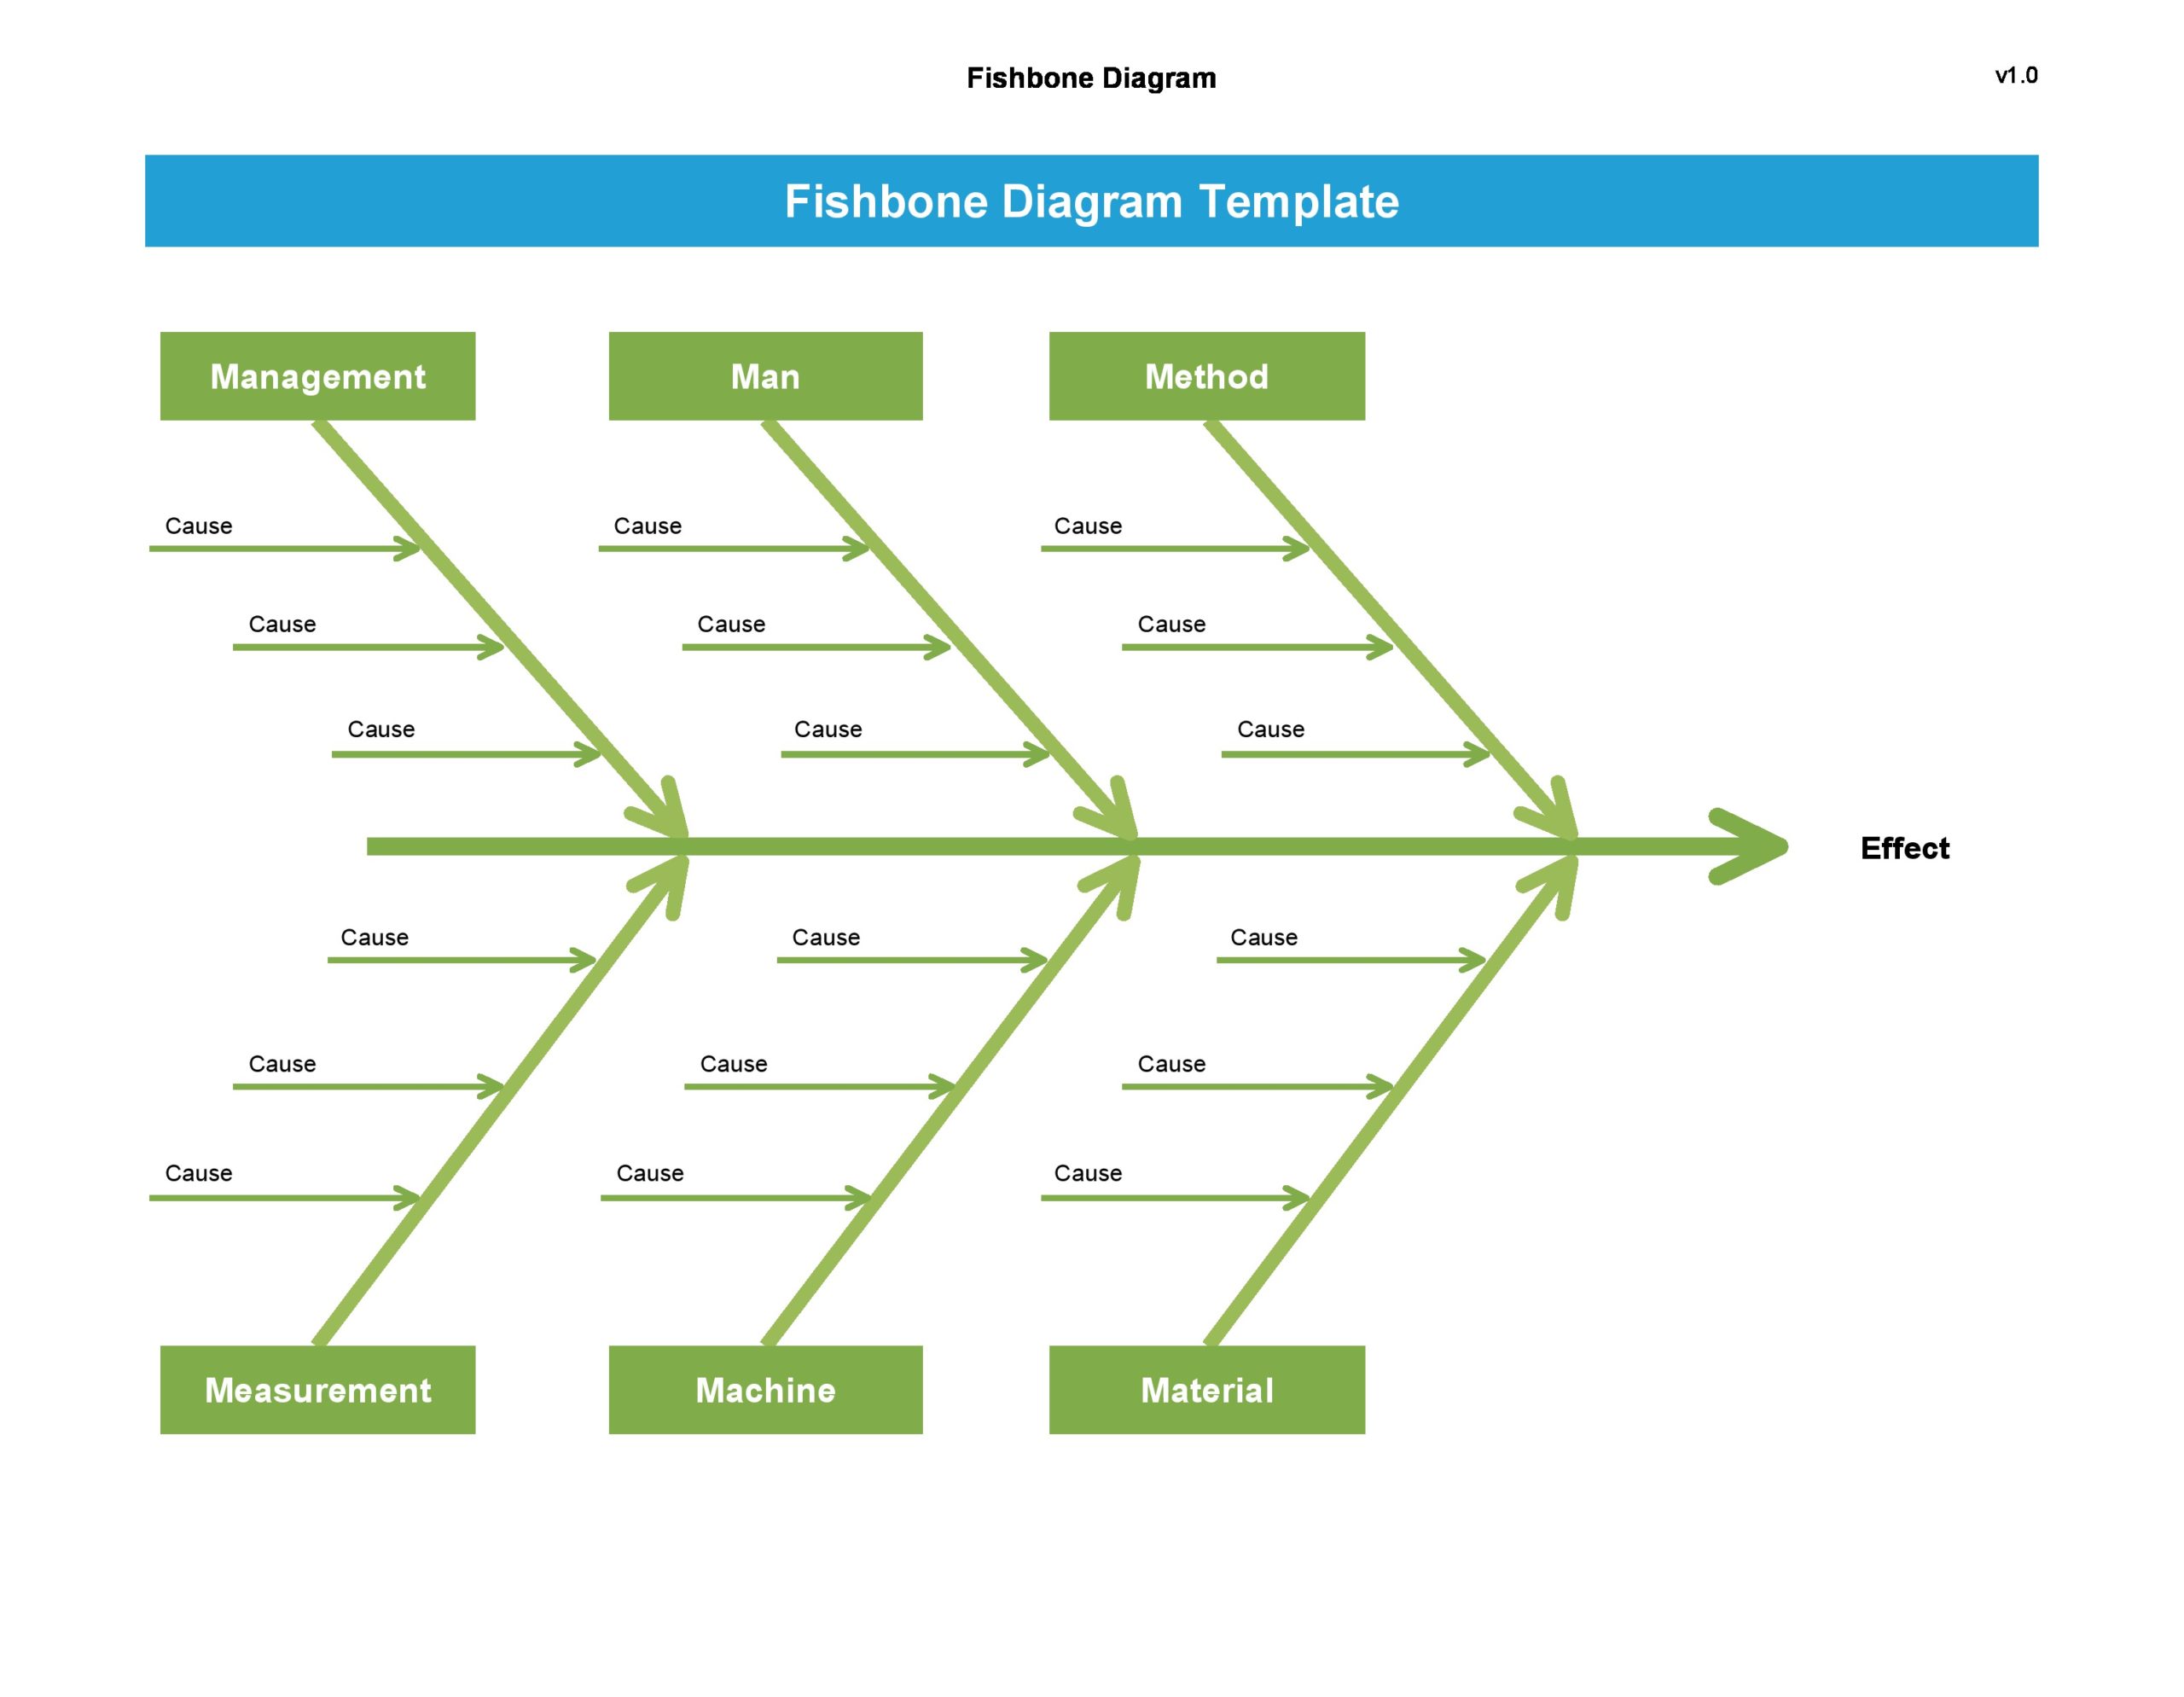
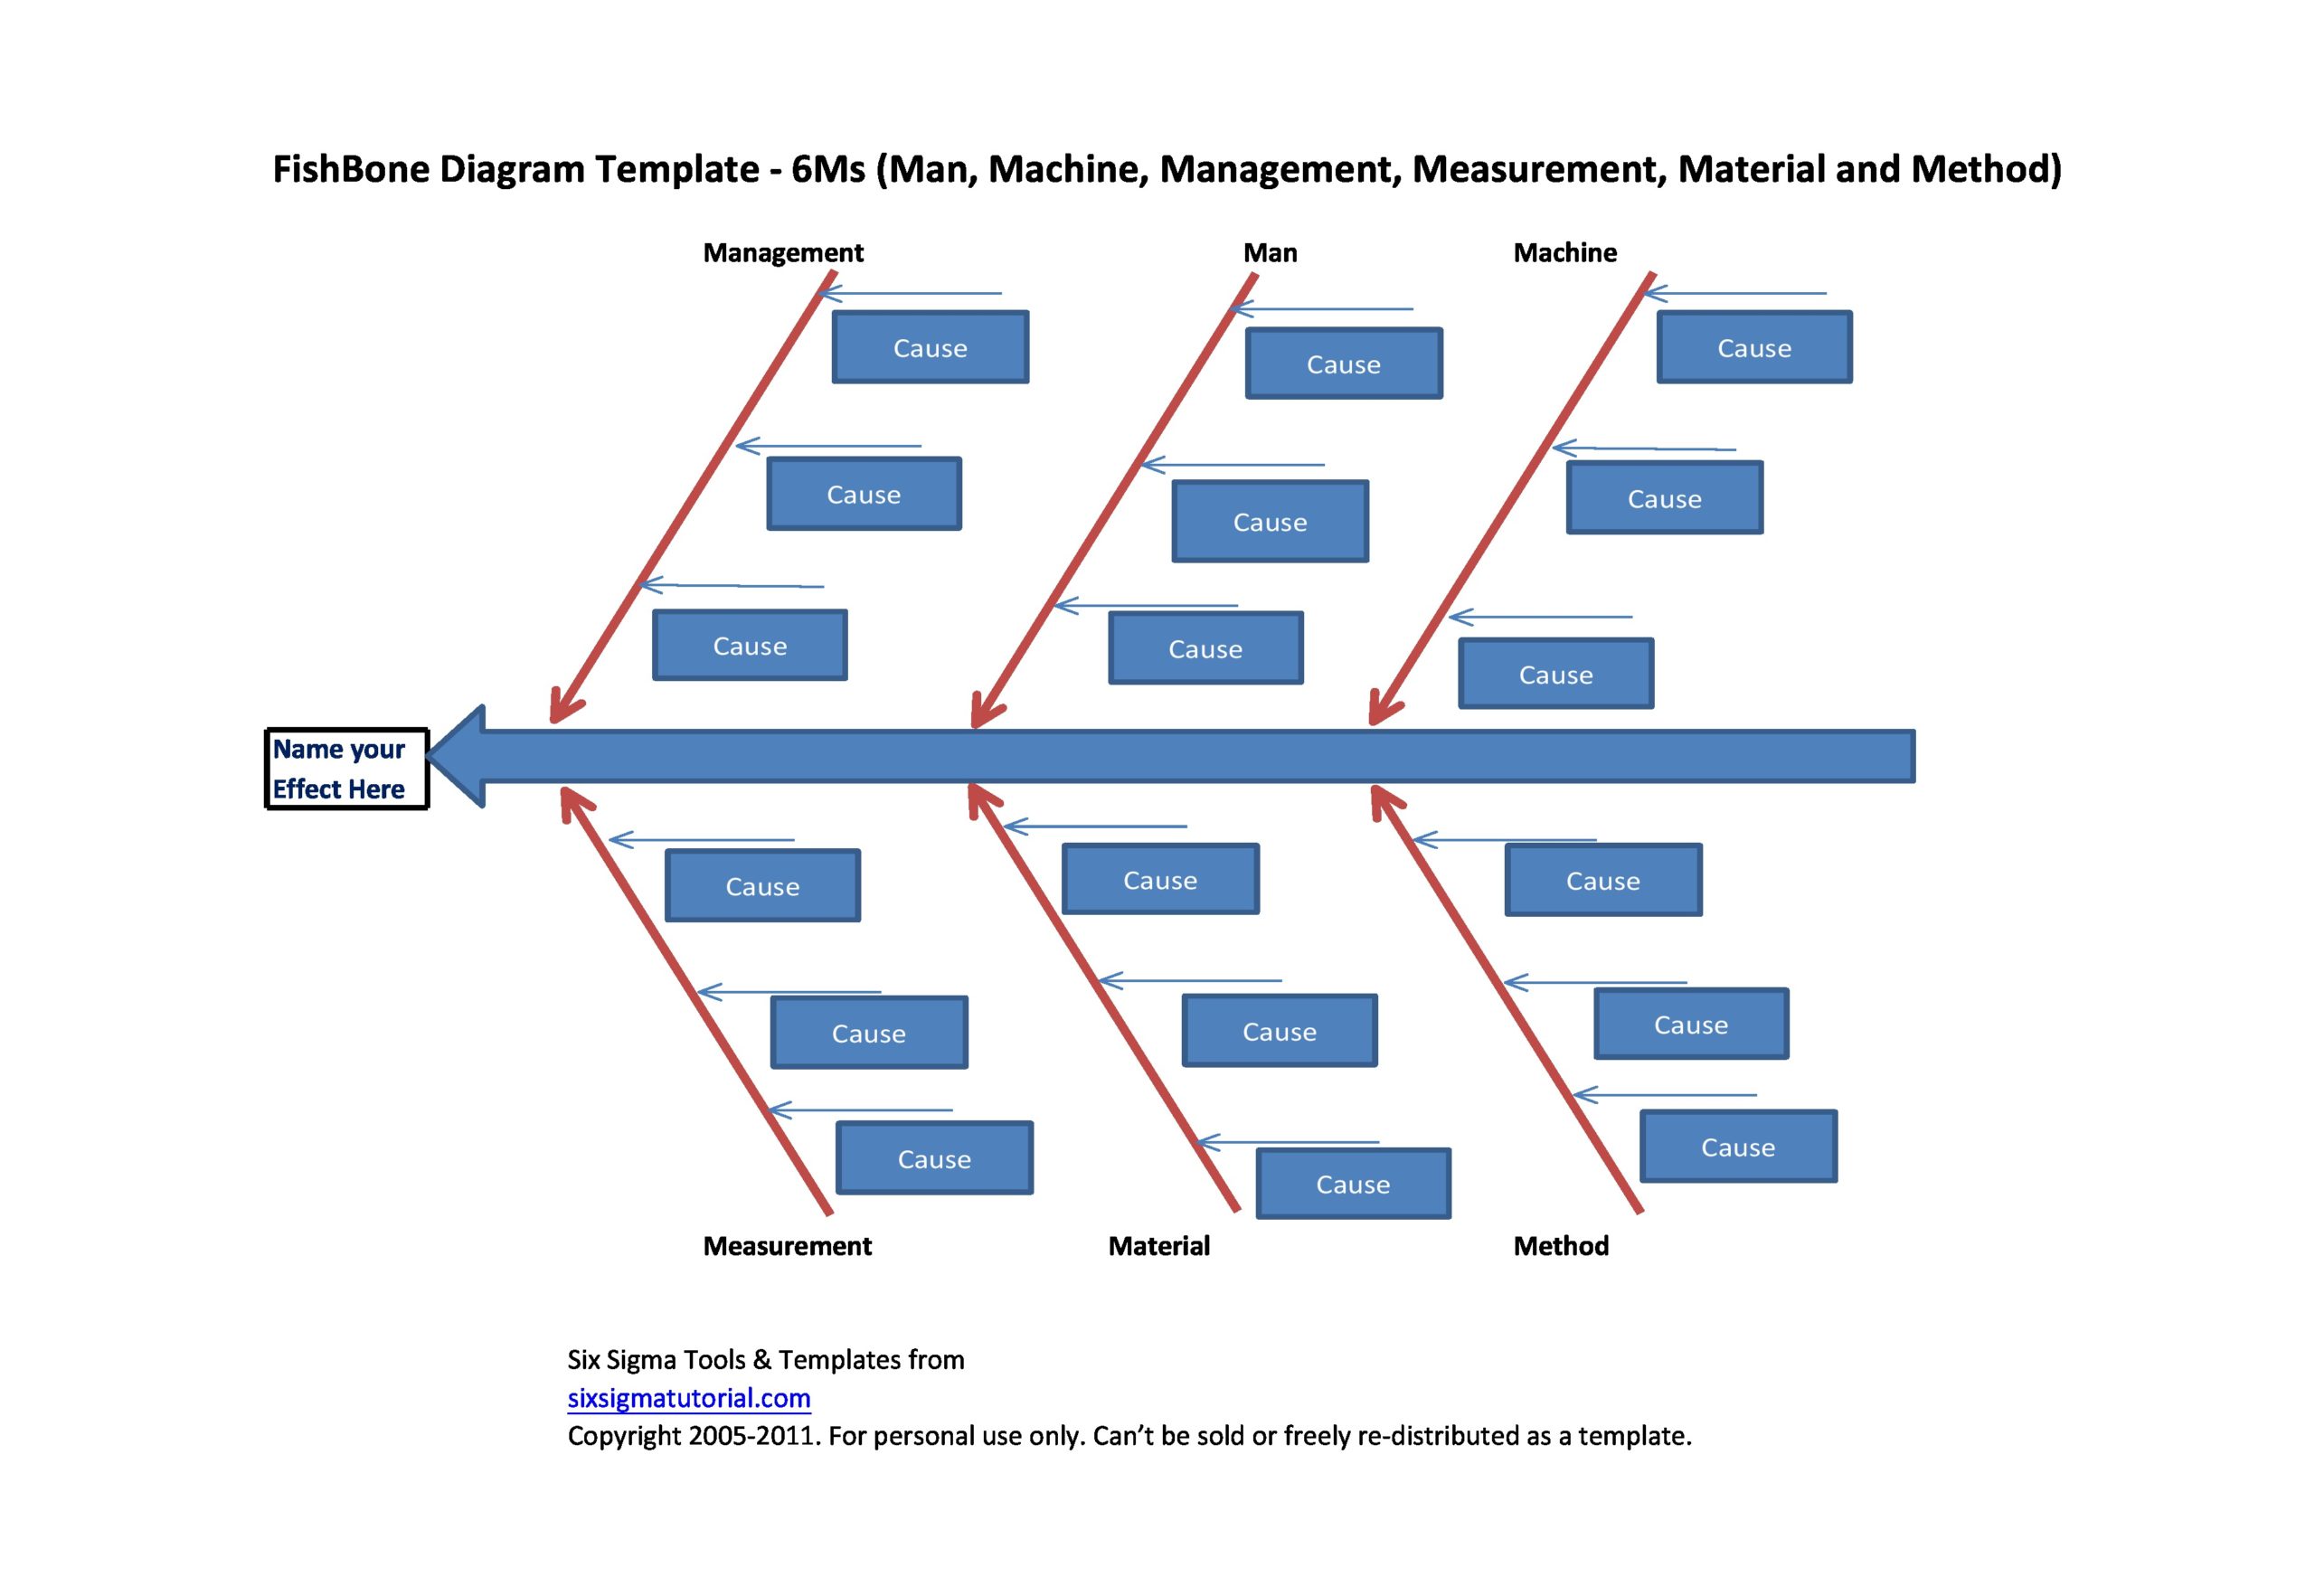
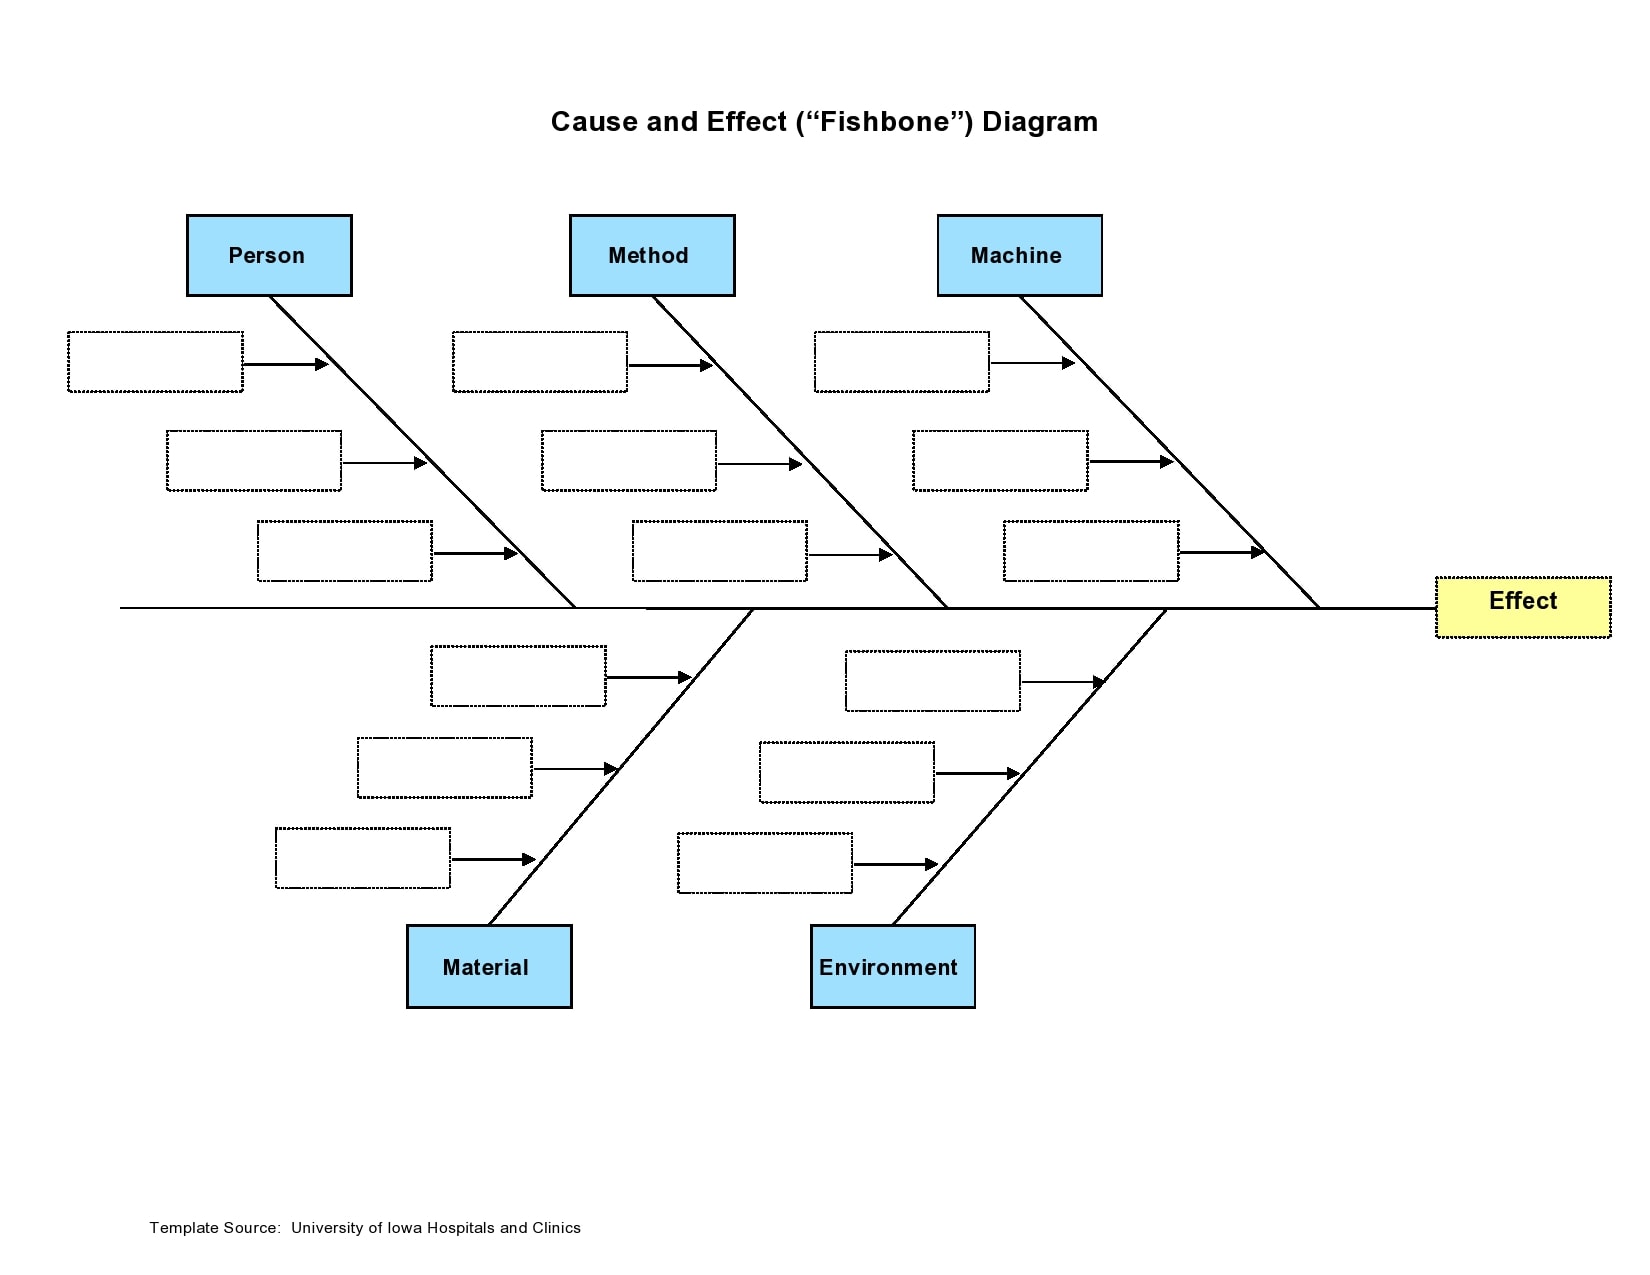
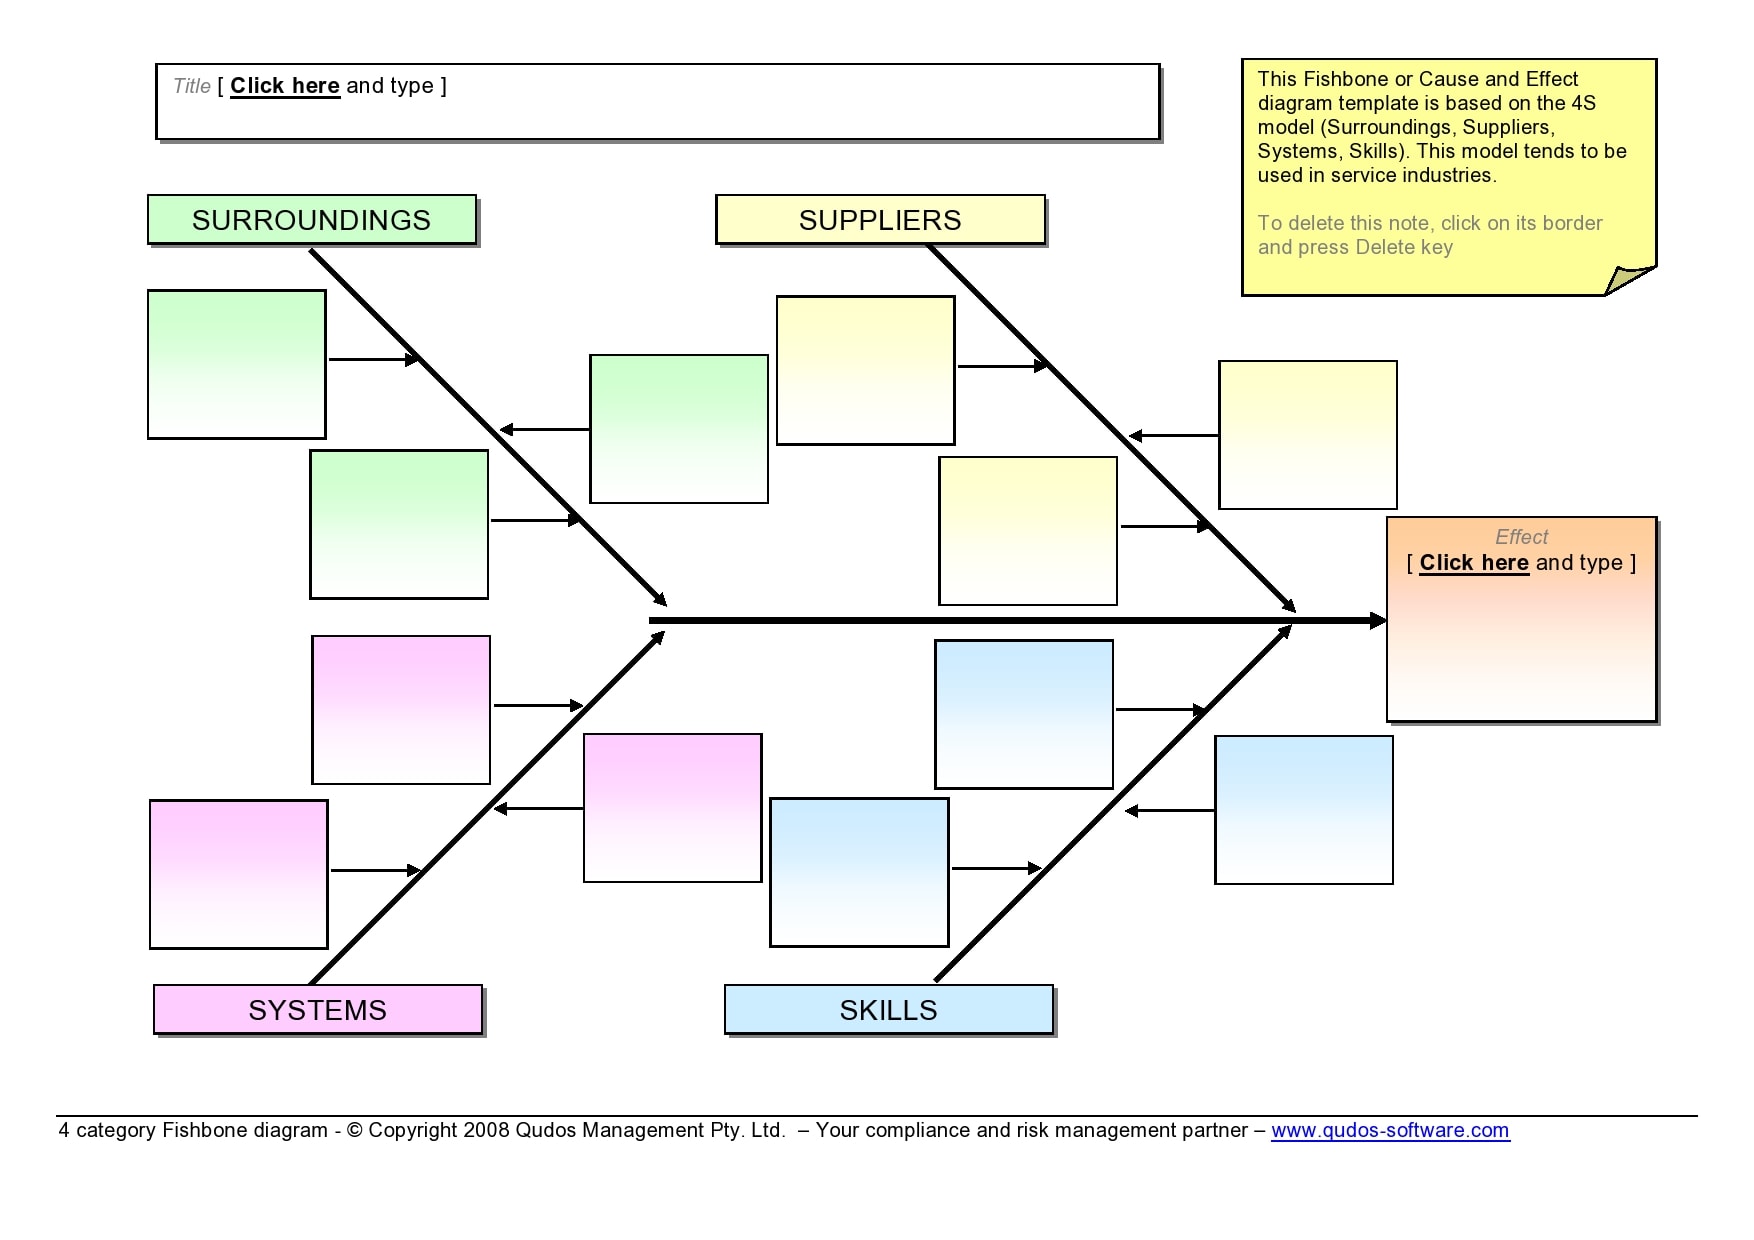
You can use this diagram to find out the factors that can potentially lead to a significant overall effect. You can group the causes into categories to make it easier to recognize causes and sources of variations. These categories are:
- Methods
These are the details of the process plus the specific requirements for performing them. Methods include rules, procedures policies, laws, and regulations. - Machines
These are the hardware or tools used to complete the jobs and tasks. Machines can include tools, equipment, and computers. - Measurements
This is the information you obtained from the process that you use for quality evaluation. - Environment
These are the times, locations, conditions, cultures, and temperatures in which the process operates. - Materials
These are the raw materials, parts, and other things used to create the final product.
Cause and Effect Charts

Why do you need one?
The fishbone diagram template is a project management tool that is very useful in troubleshooting and product development. It is one of the tools that you can use during quality management analyses.
Its application ensures that projects forward without any hindrance. In addition, the cause and effect chart also proves useful when you encounter a road-block and you can’t find a cause using quantitative data. You then use the diagram to spontaneously discuss any potential underlying issues.
Fishbone analysis can also have applications in the healthcare and medical sector. You can use it to inspect an incident report then identify the accident’s root cause to prevent it from reoccurring in the future.
In the same manner, in a laboratory setting, the diagram can be very helpful in risk management to pinpoint any causes for concern and make improvements in processes.
What is fishbone diagram with examples?
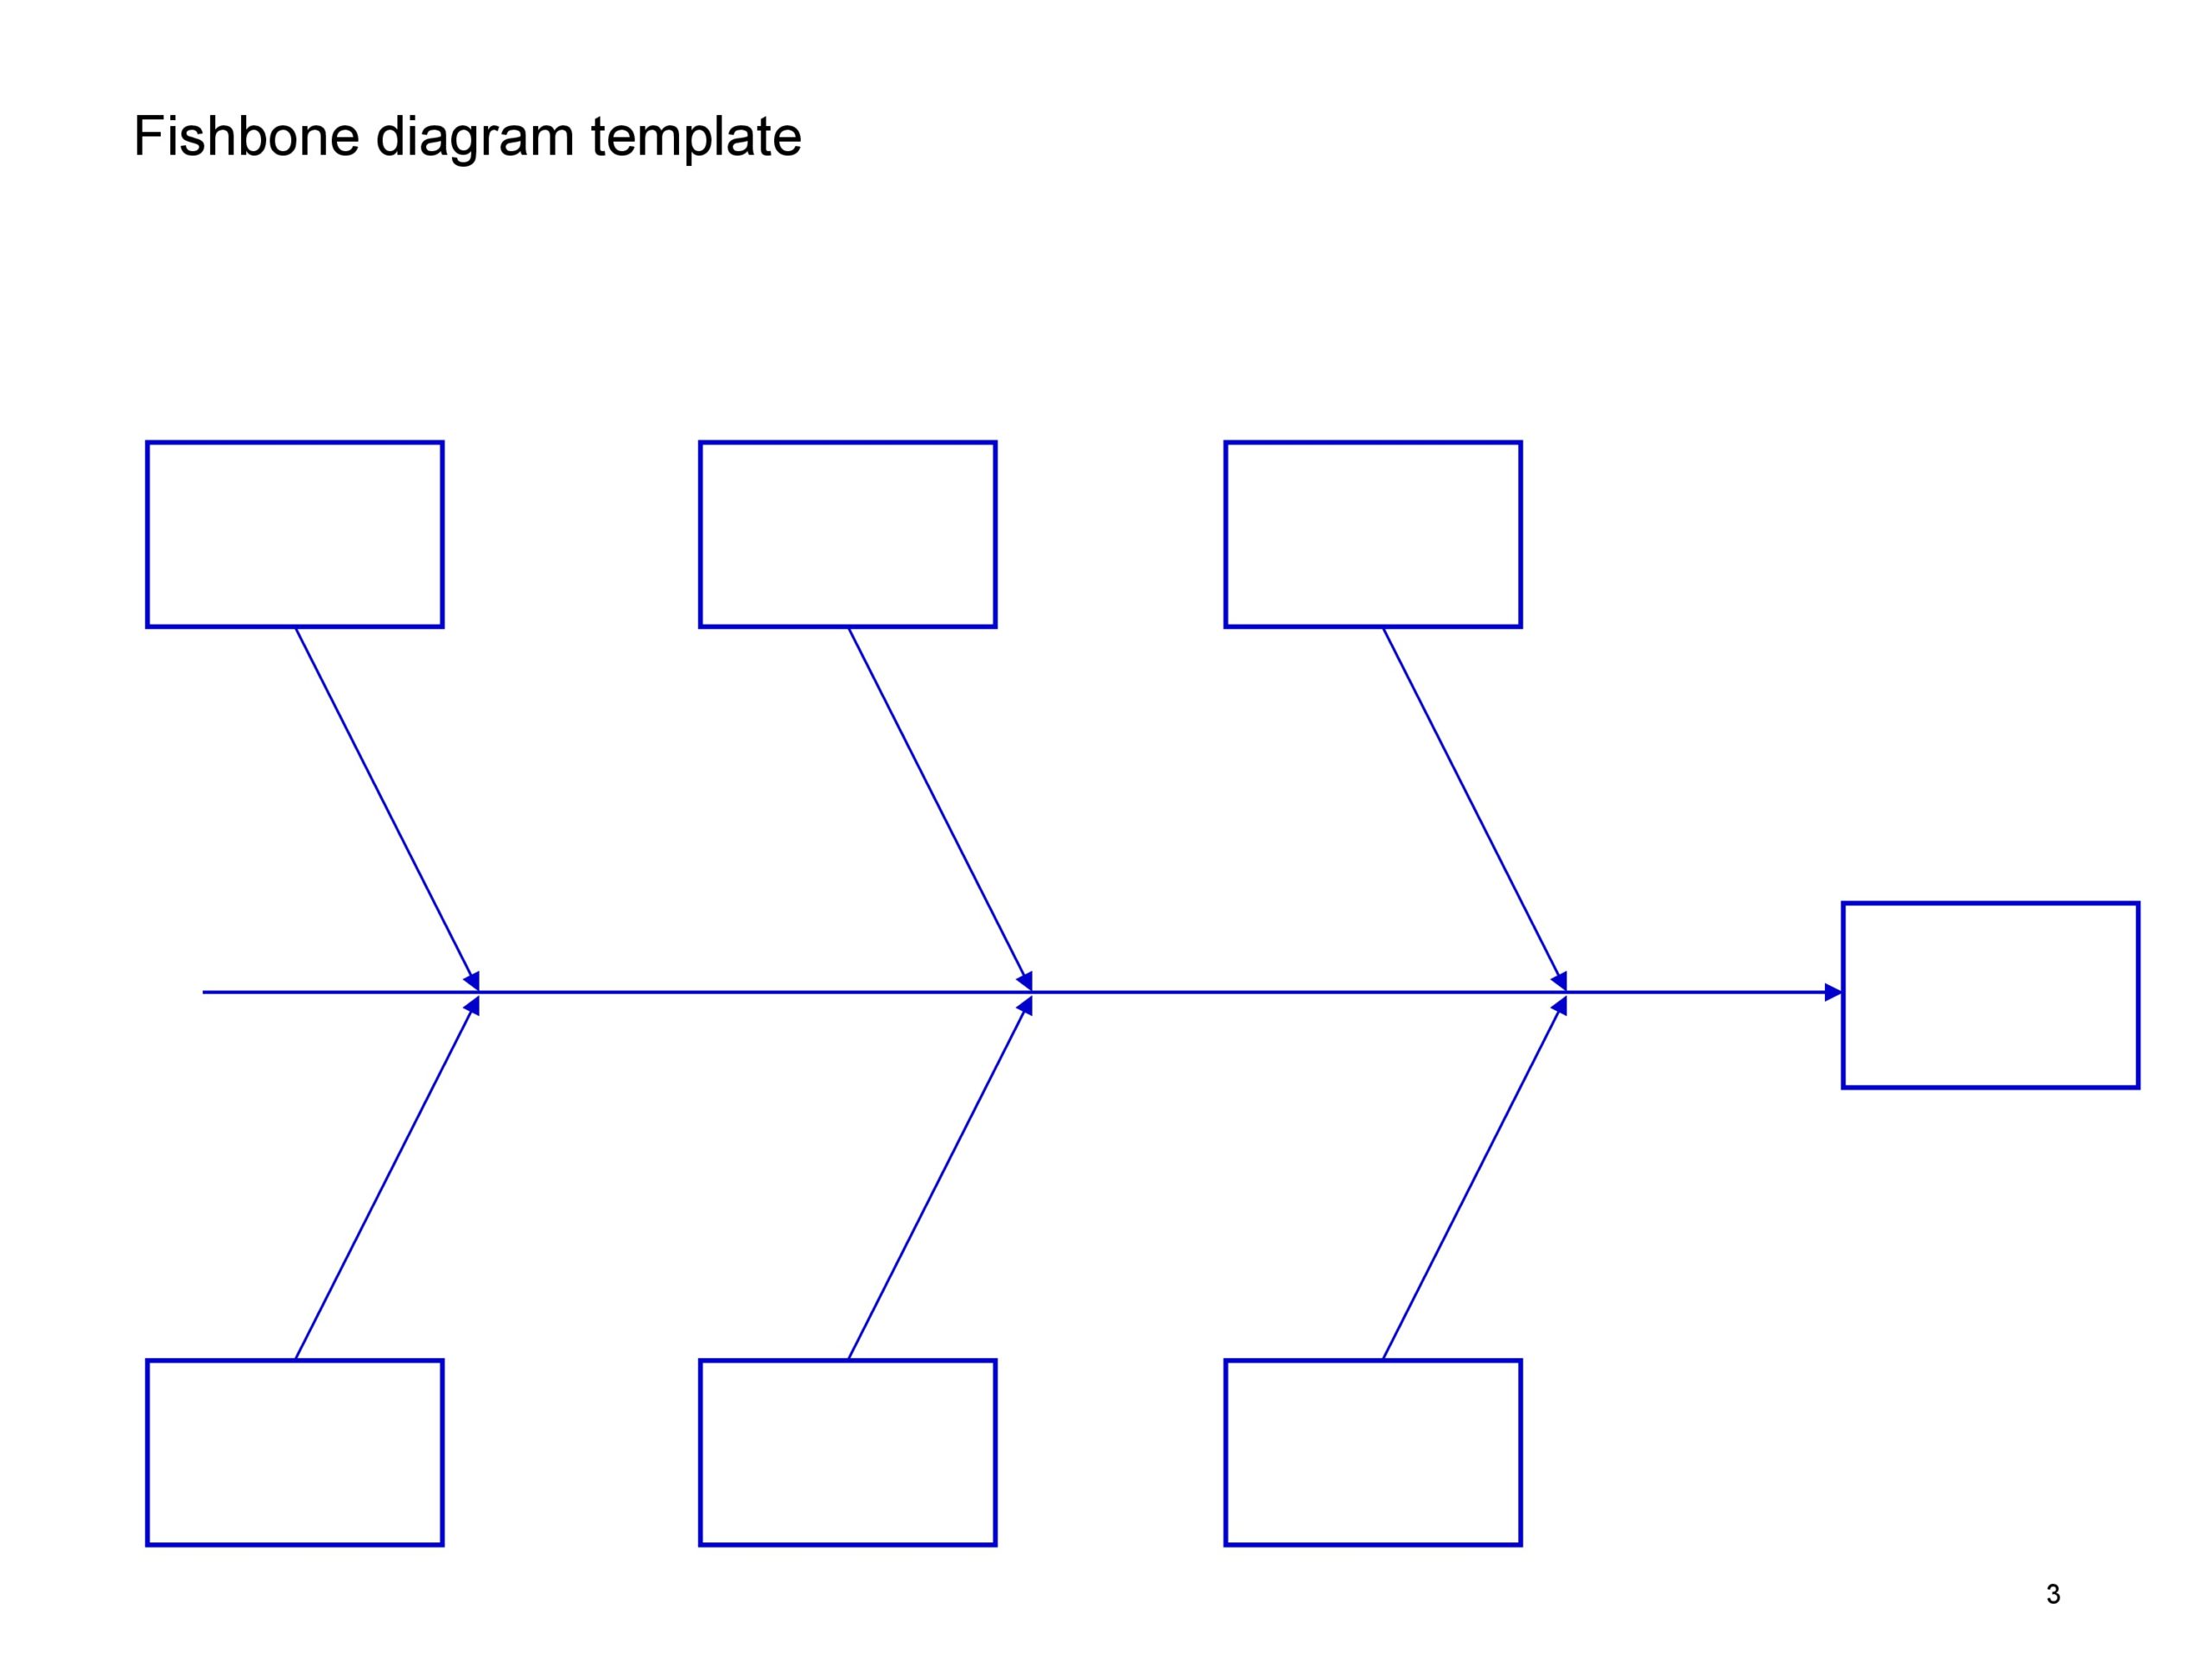
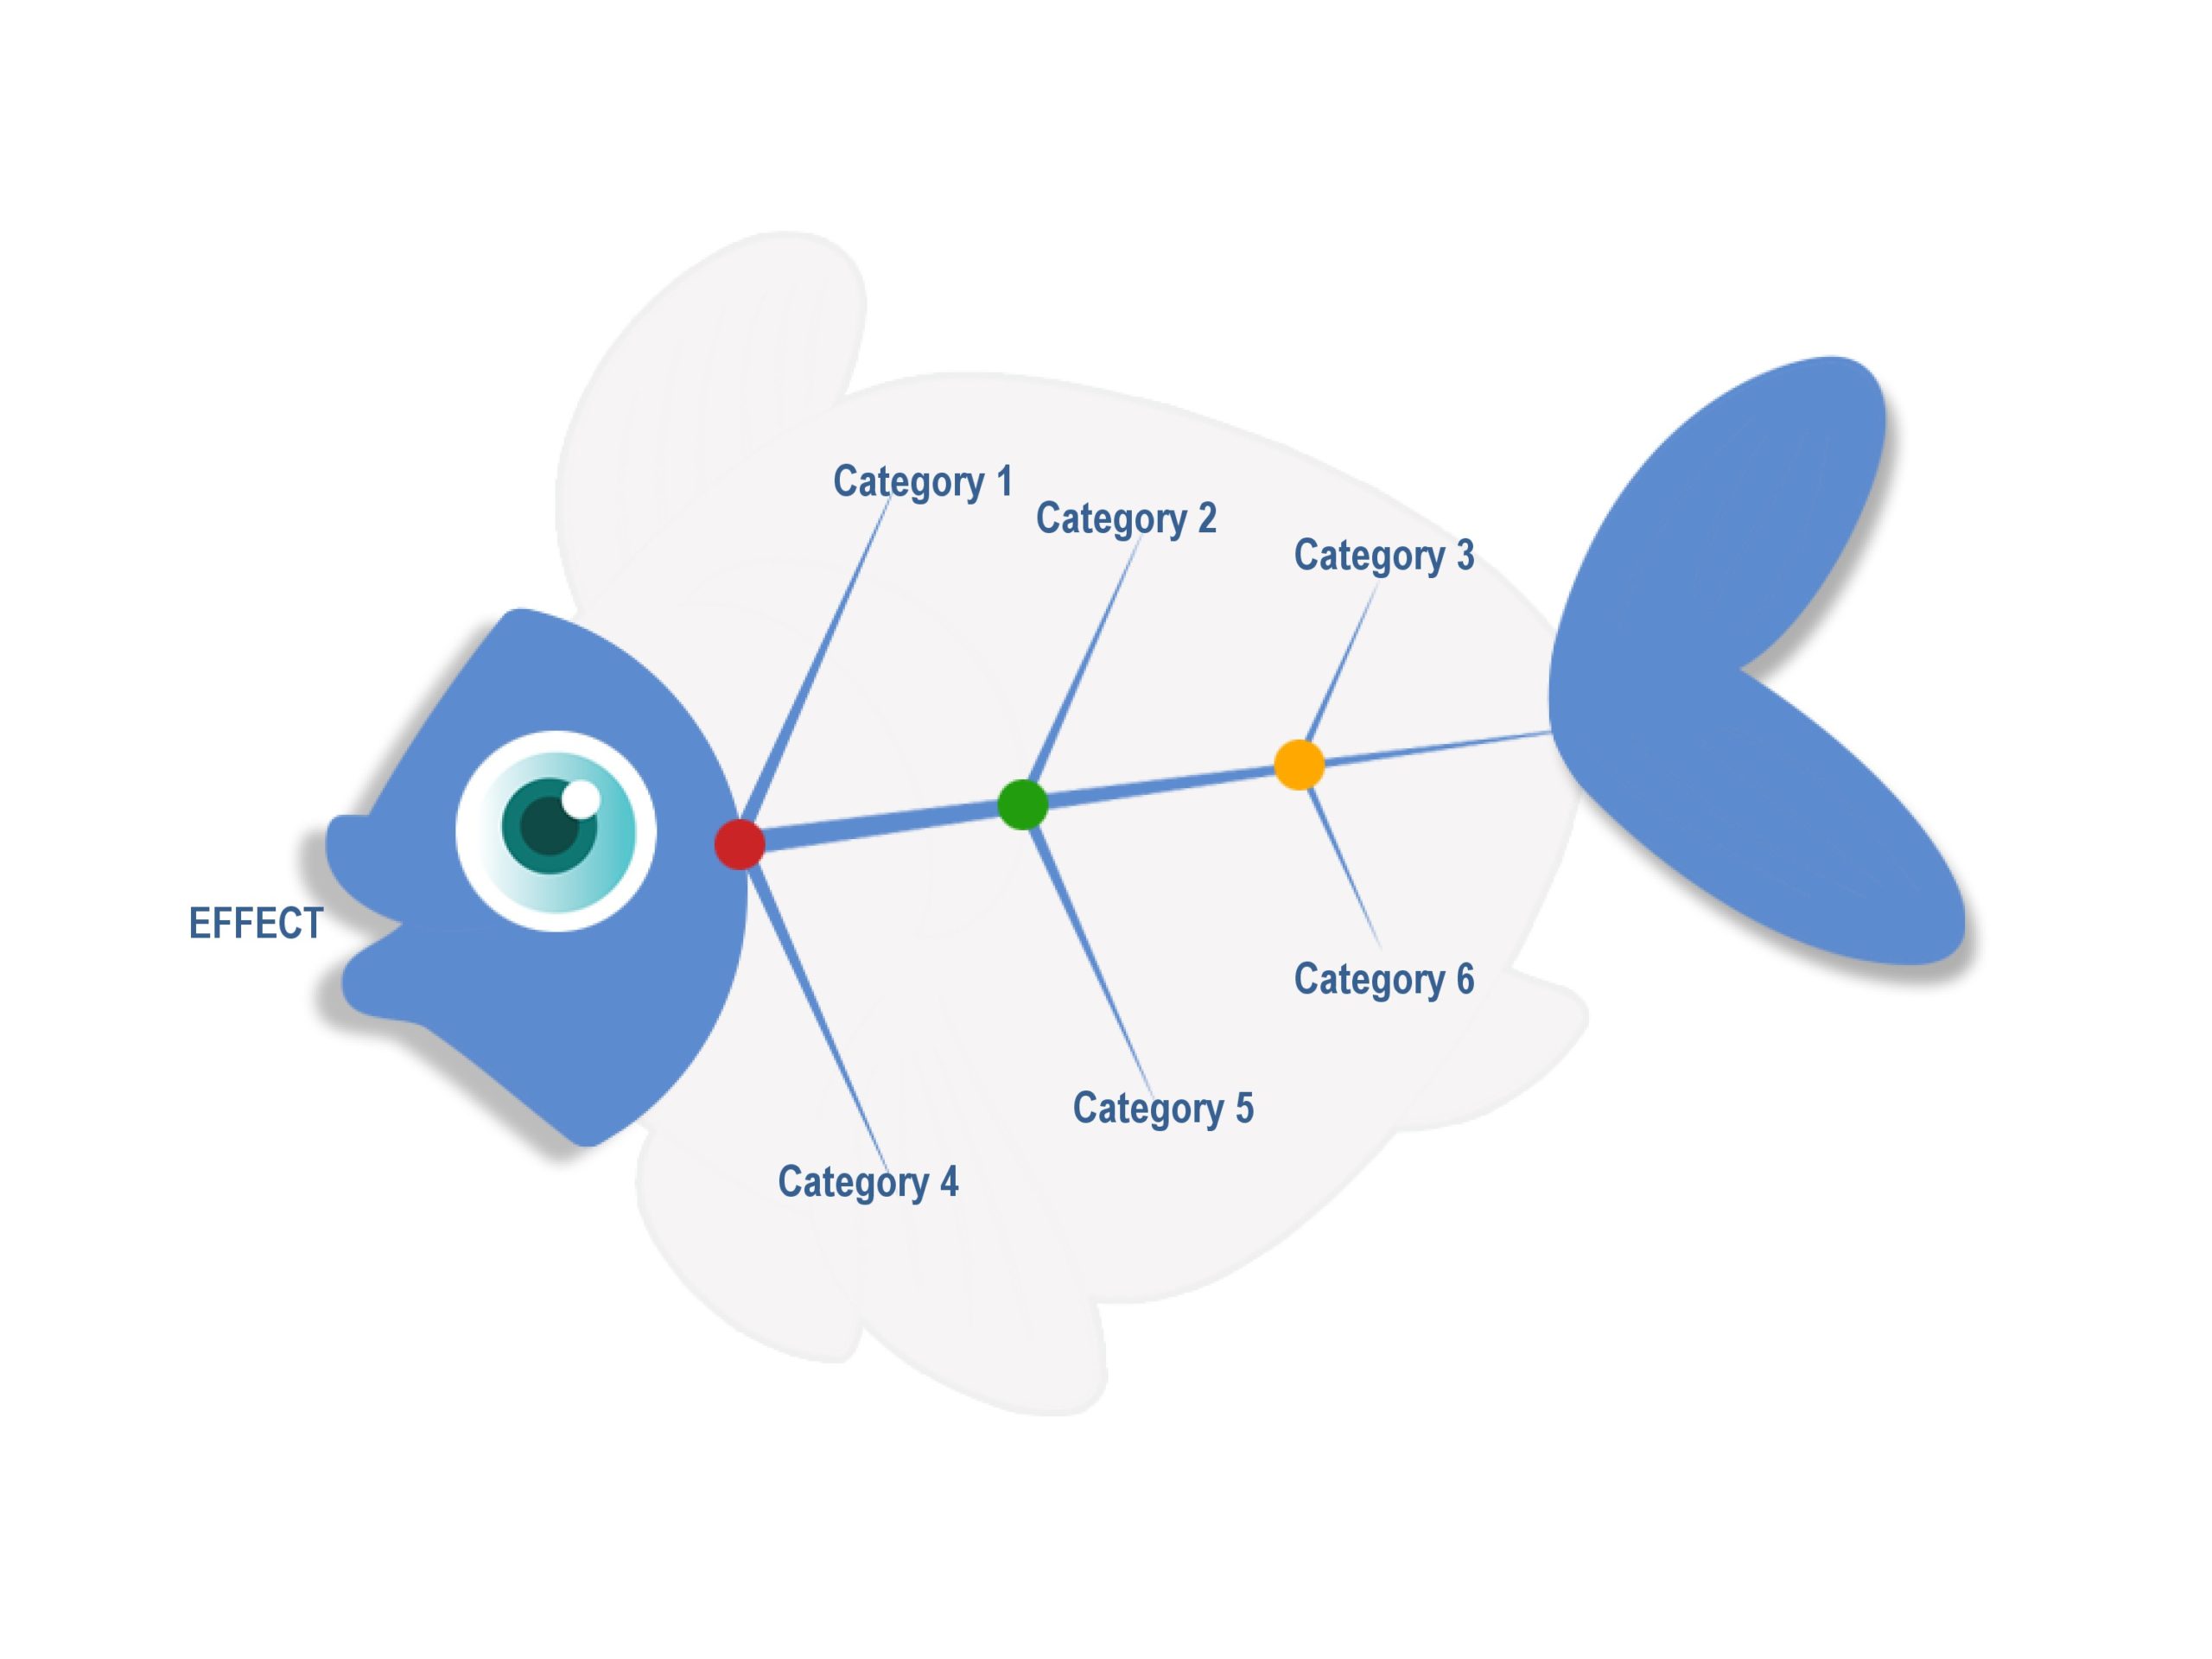
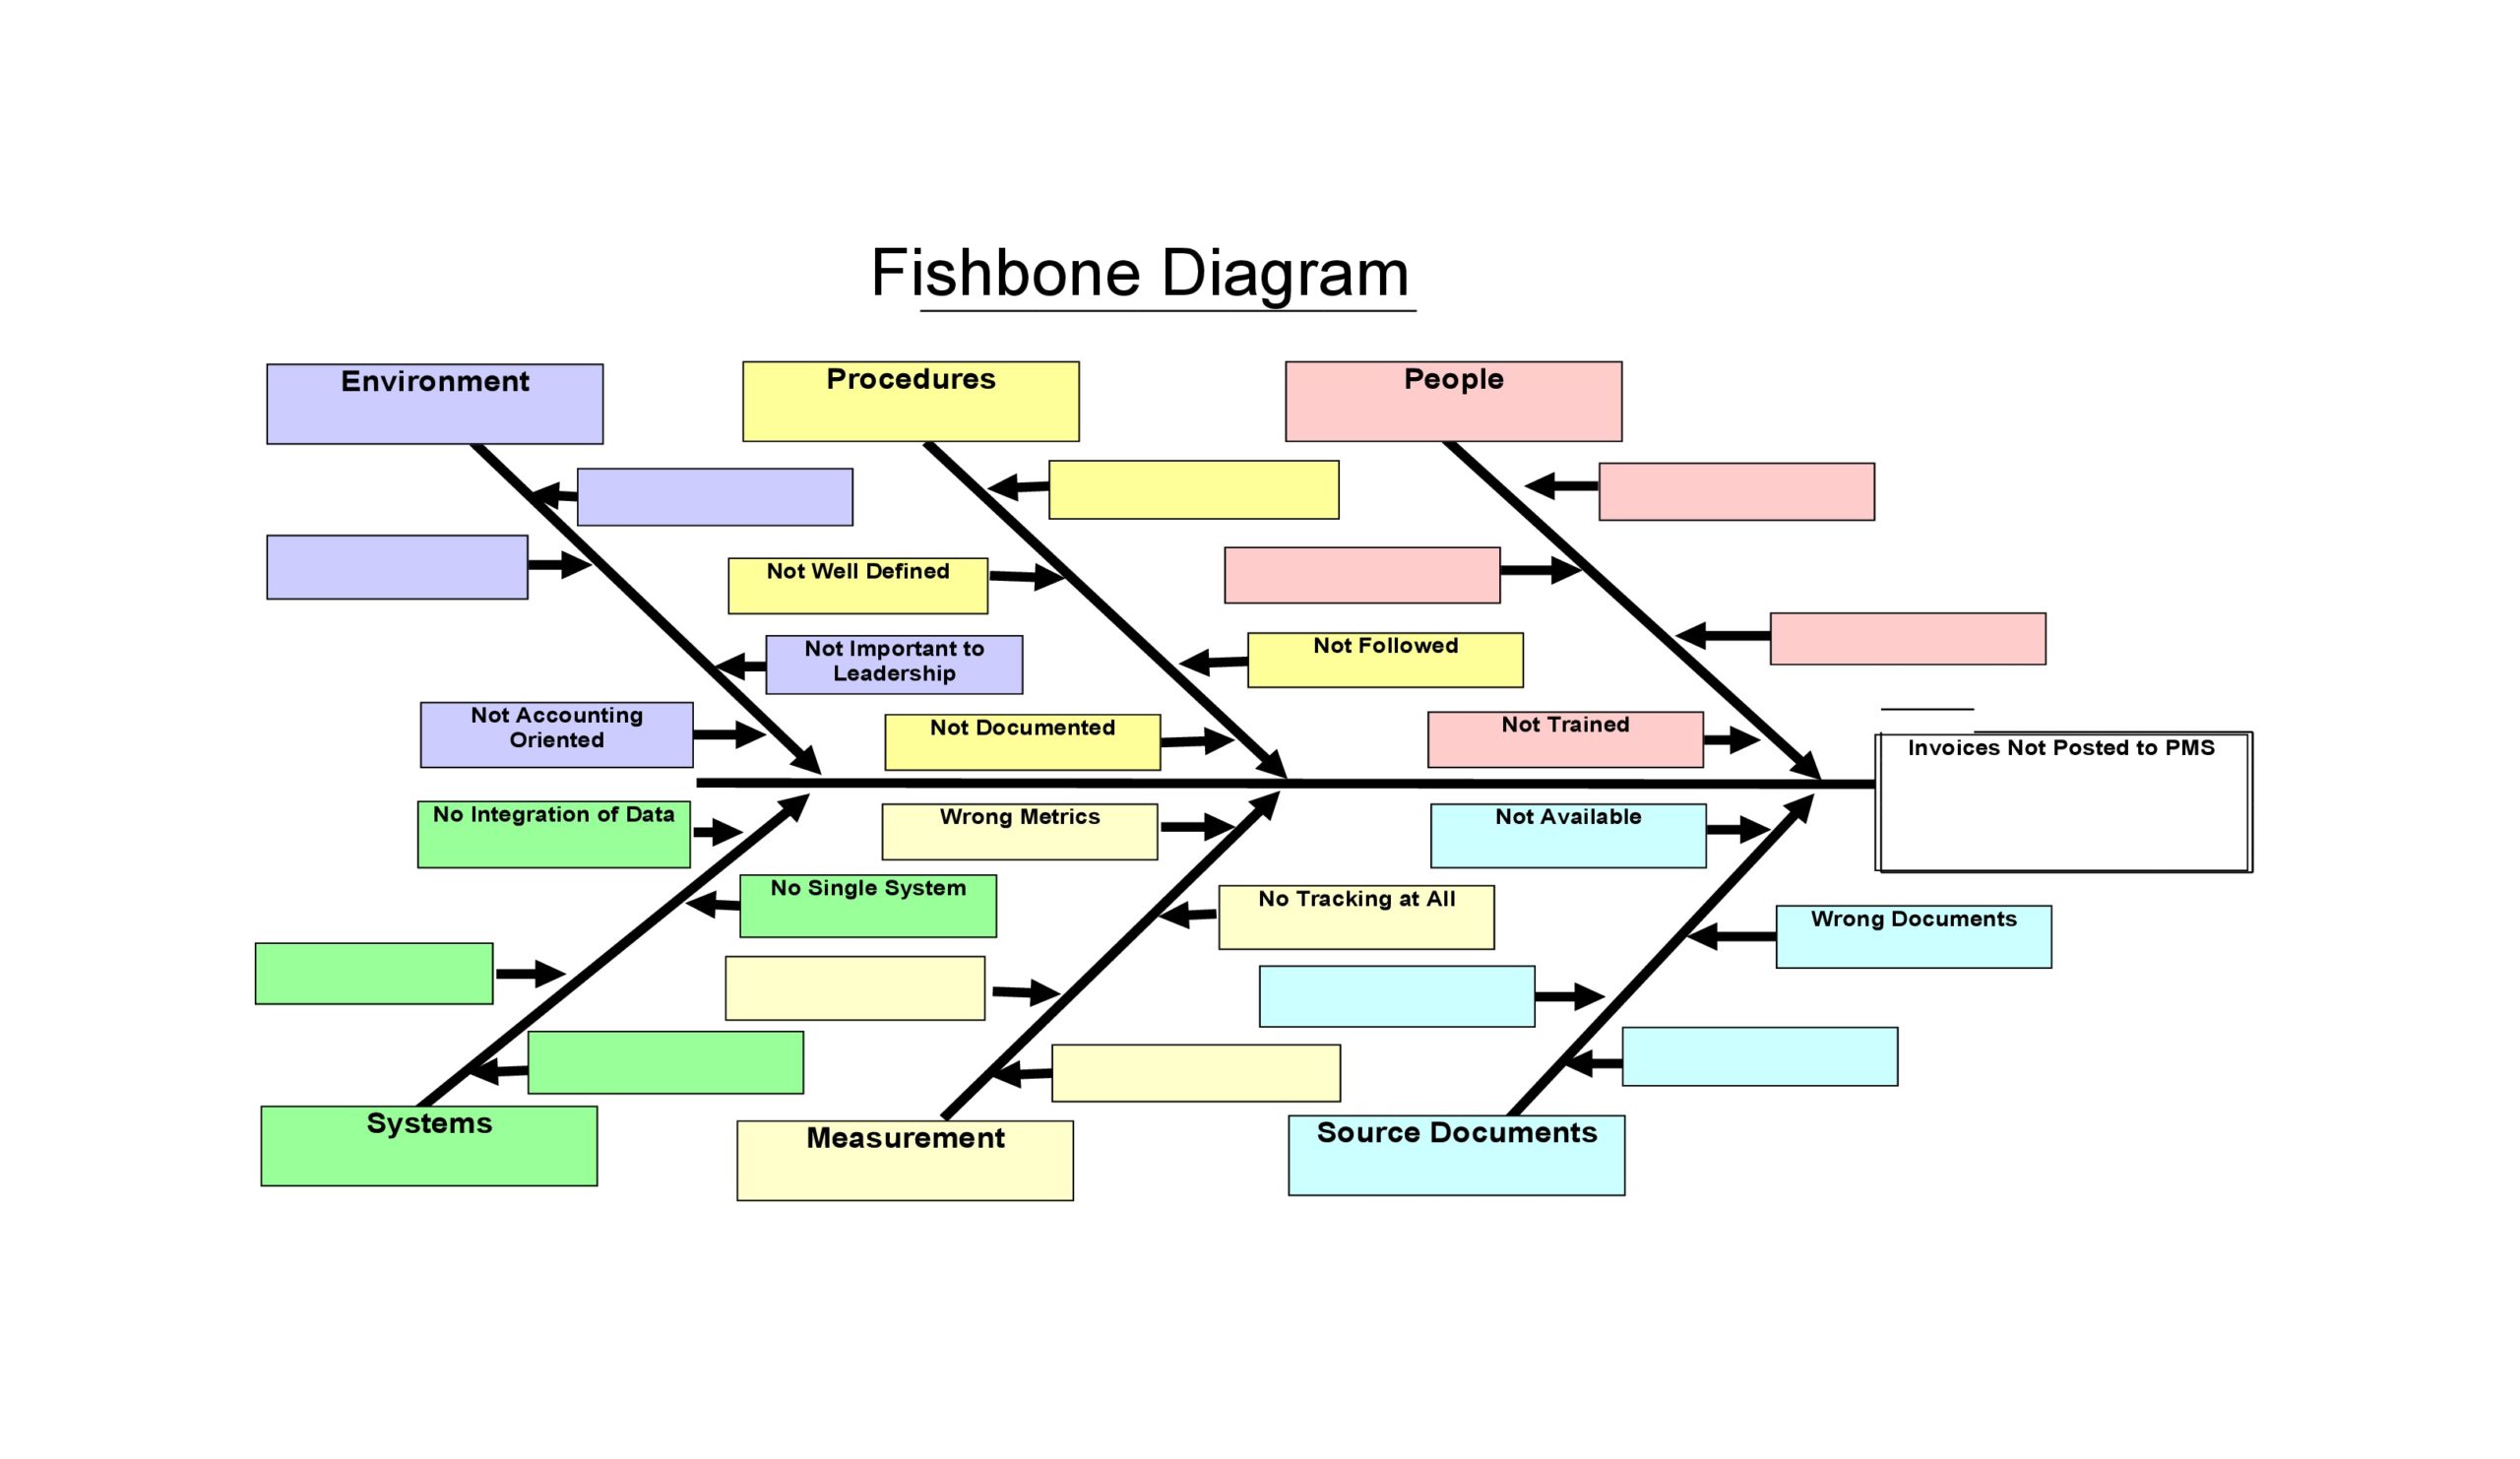
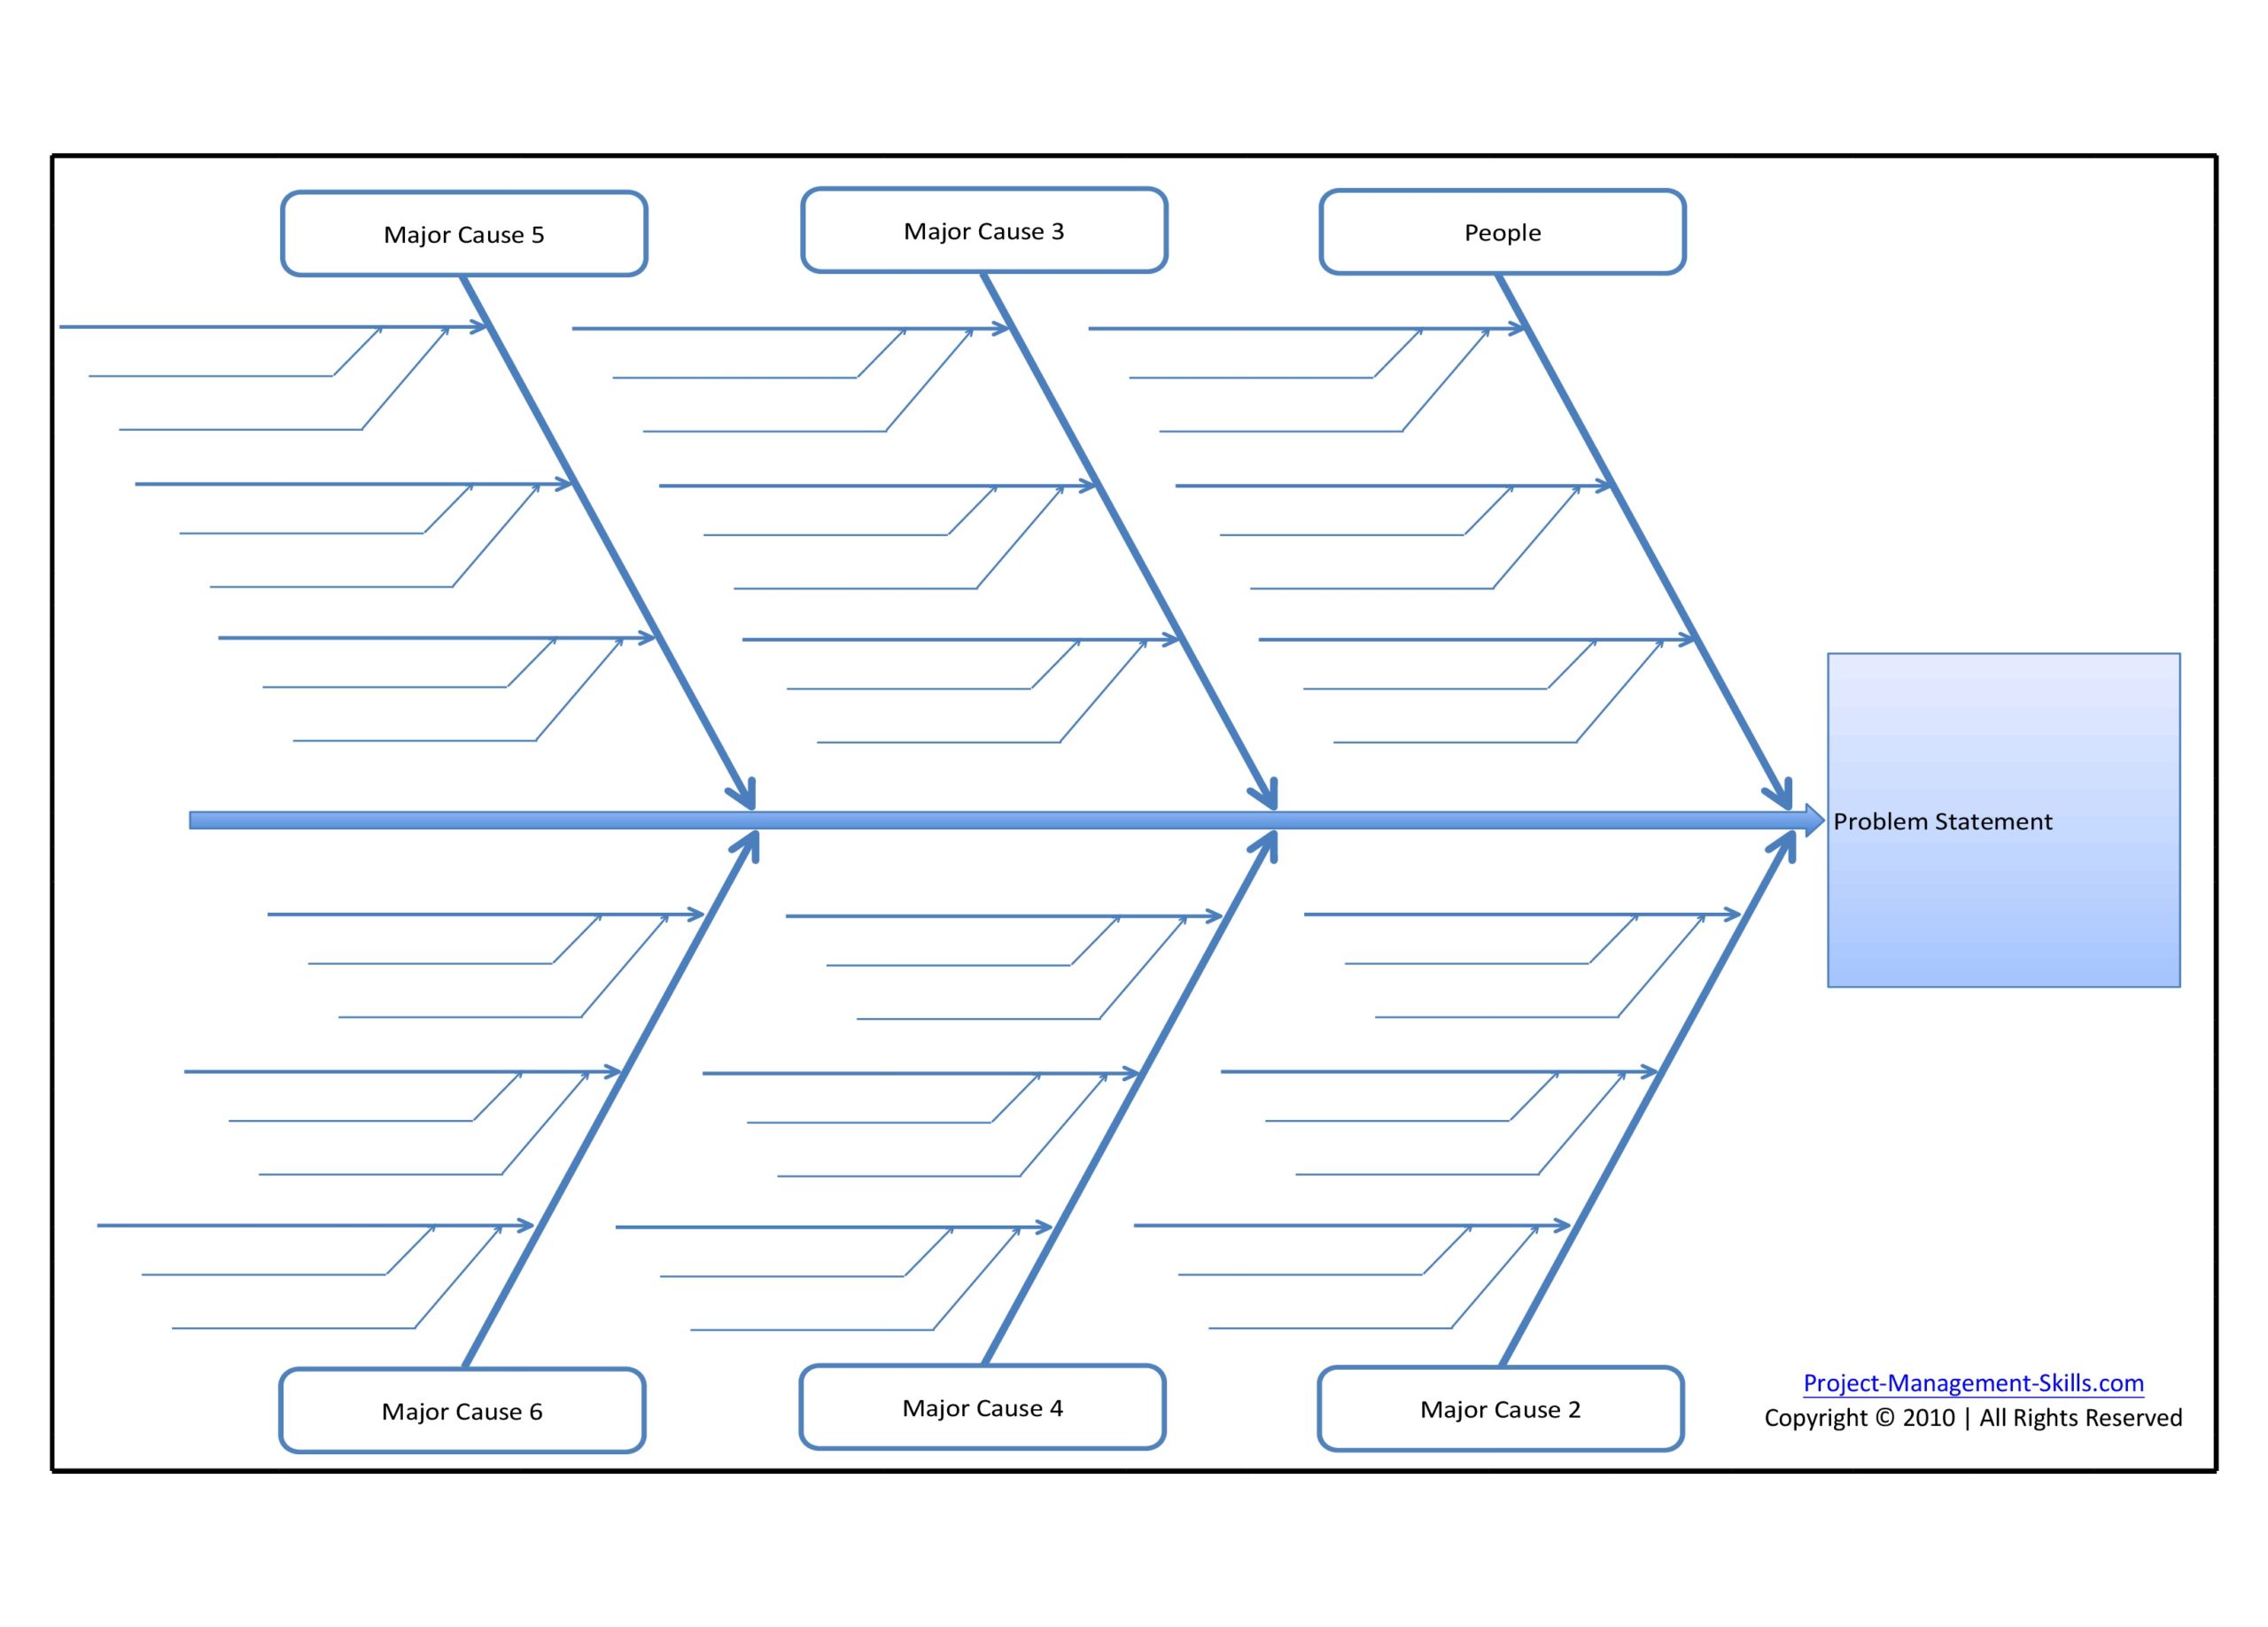
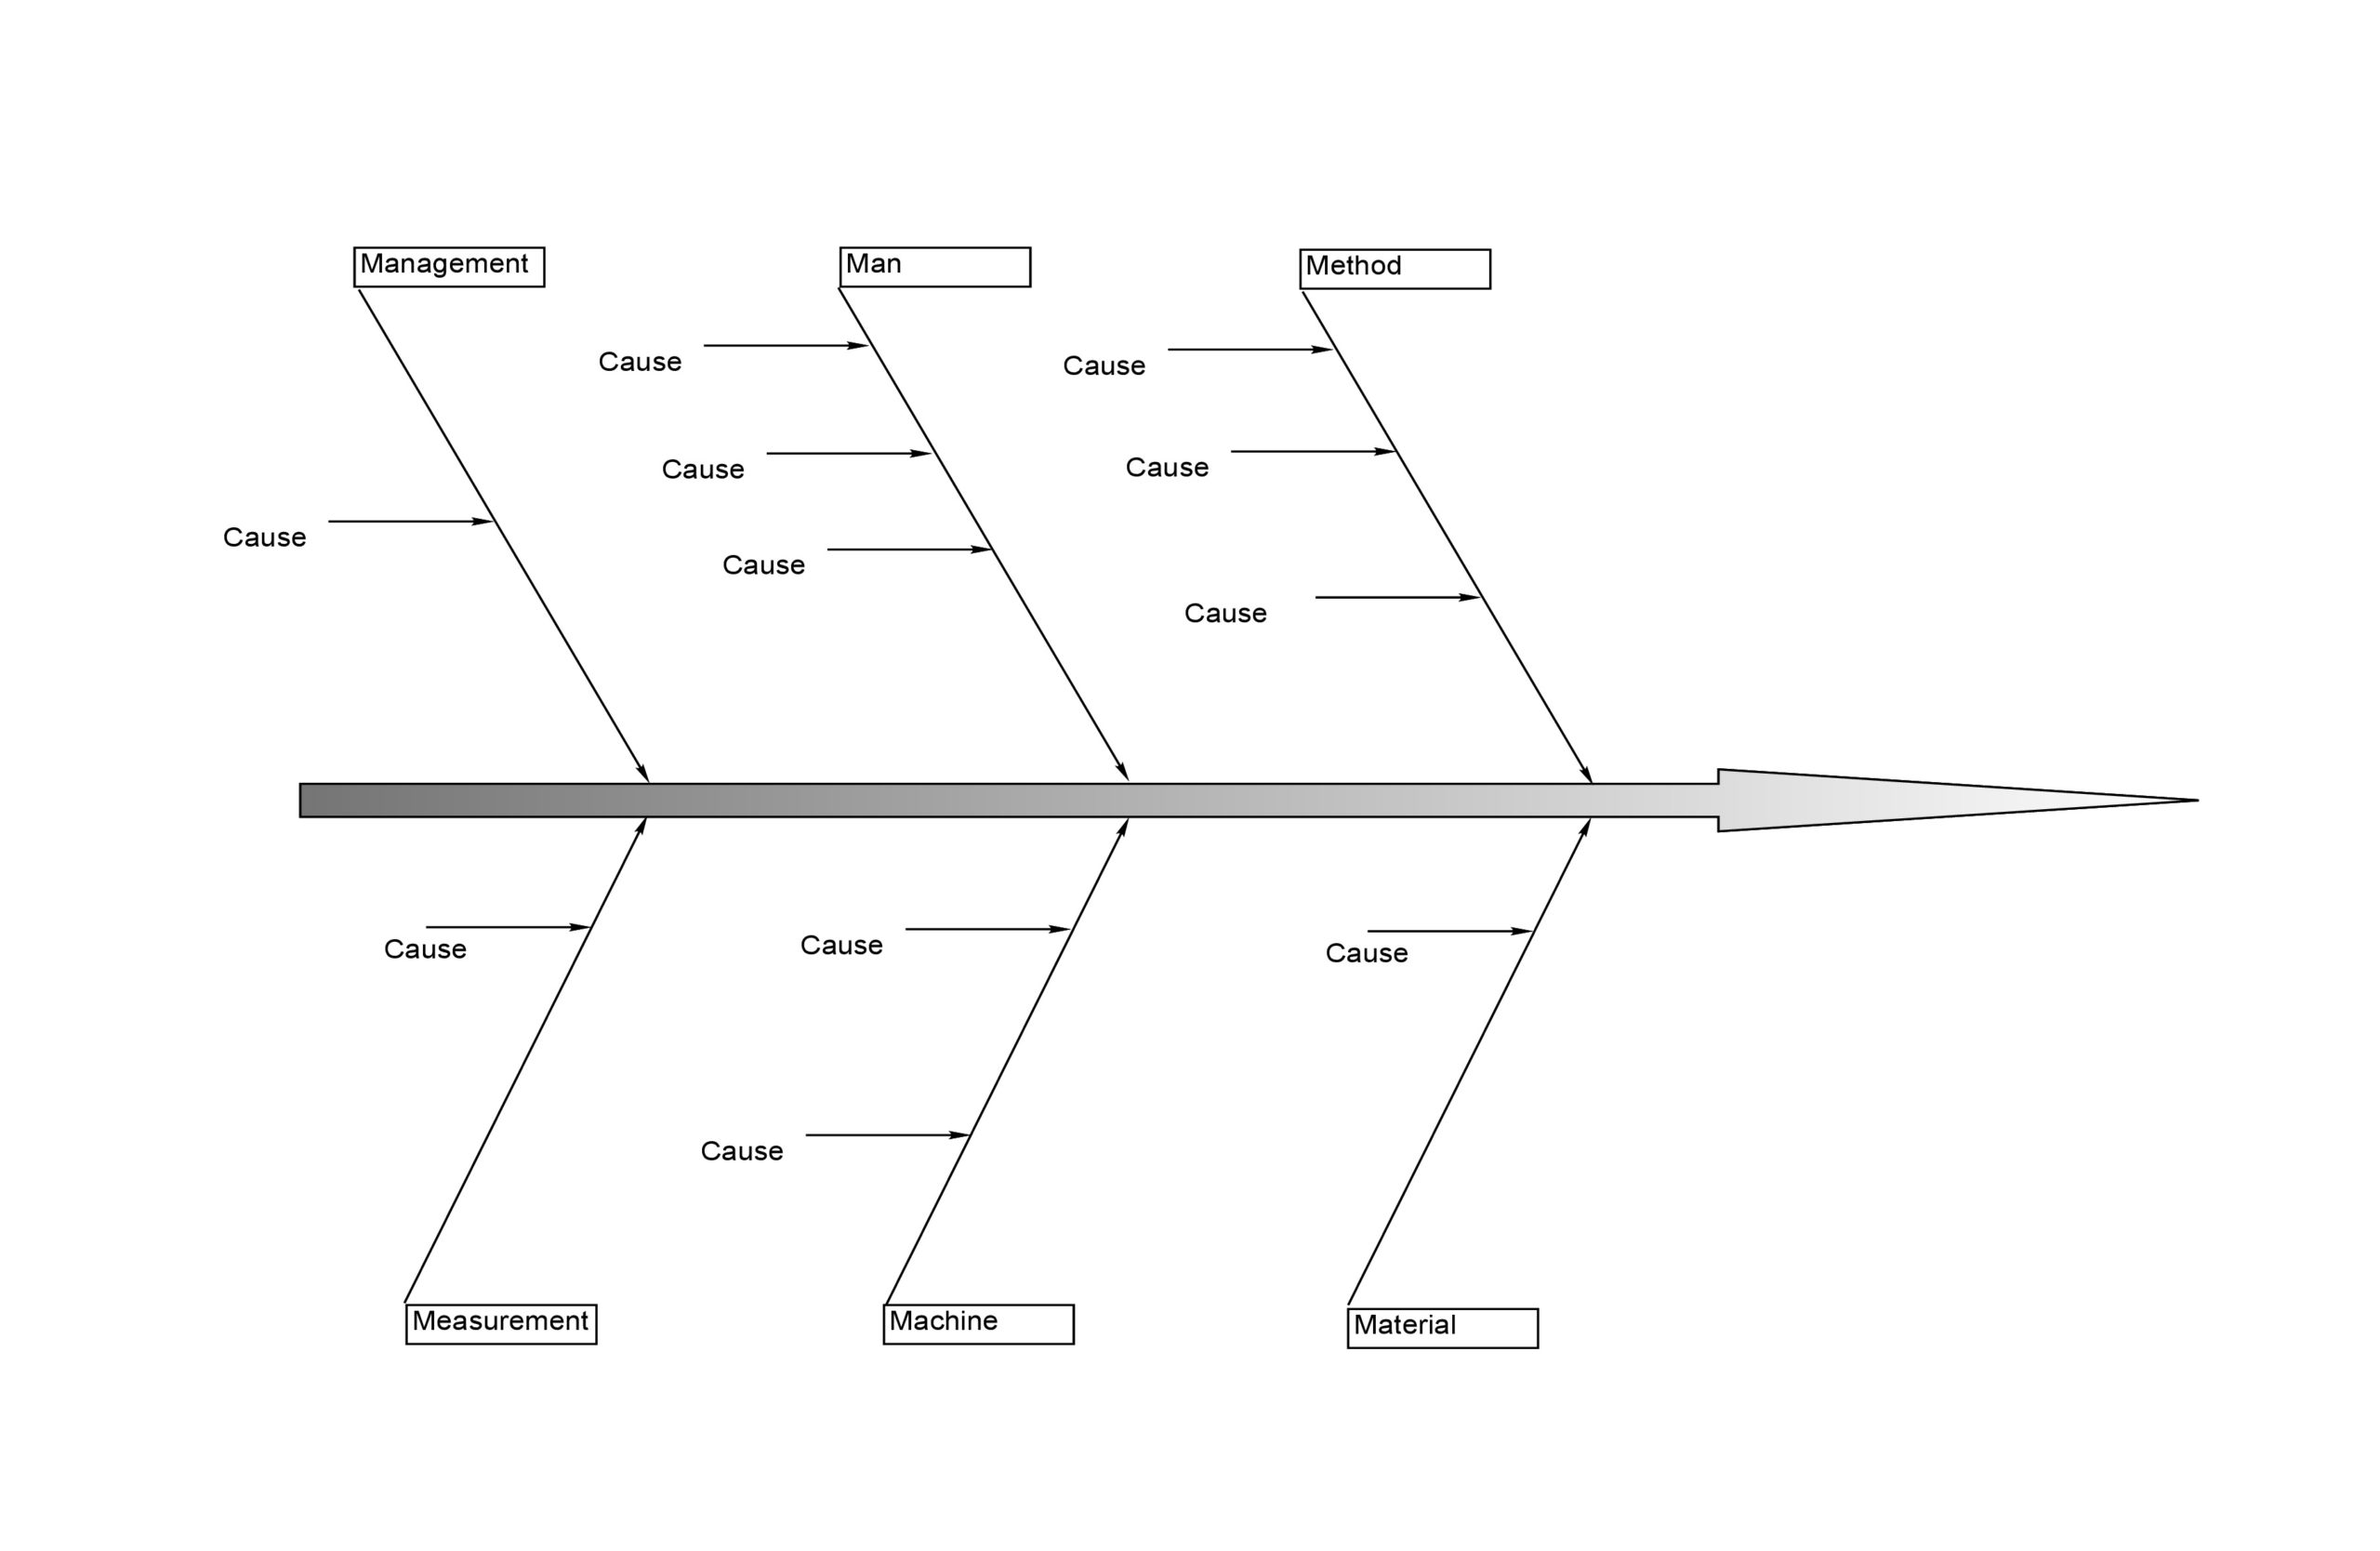
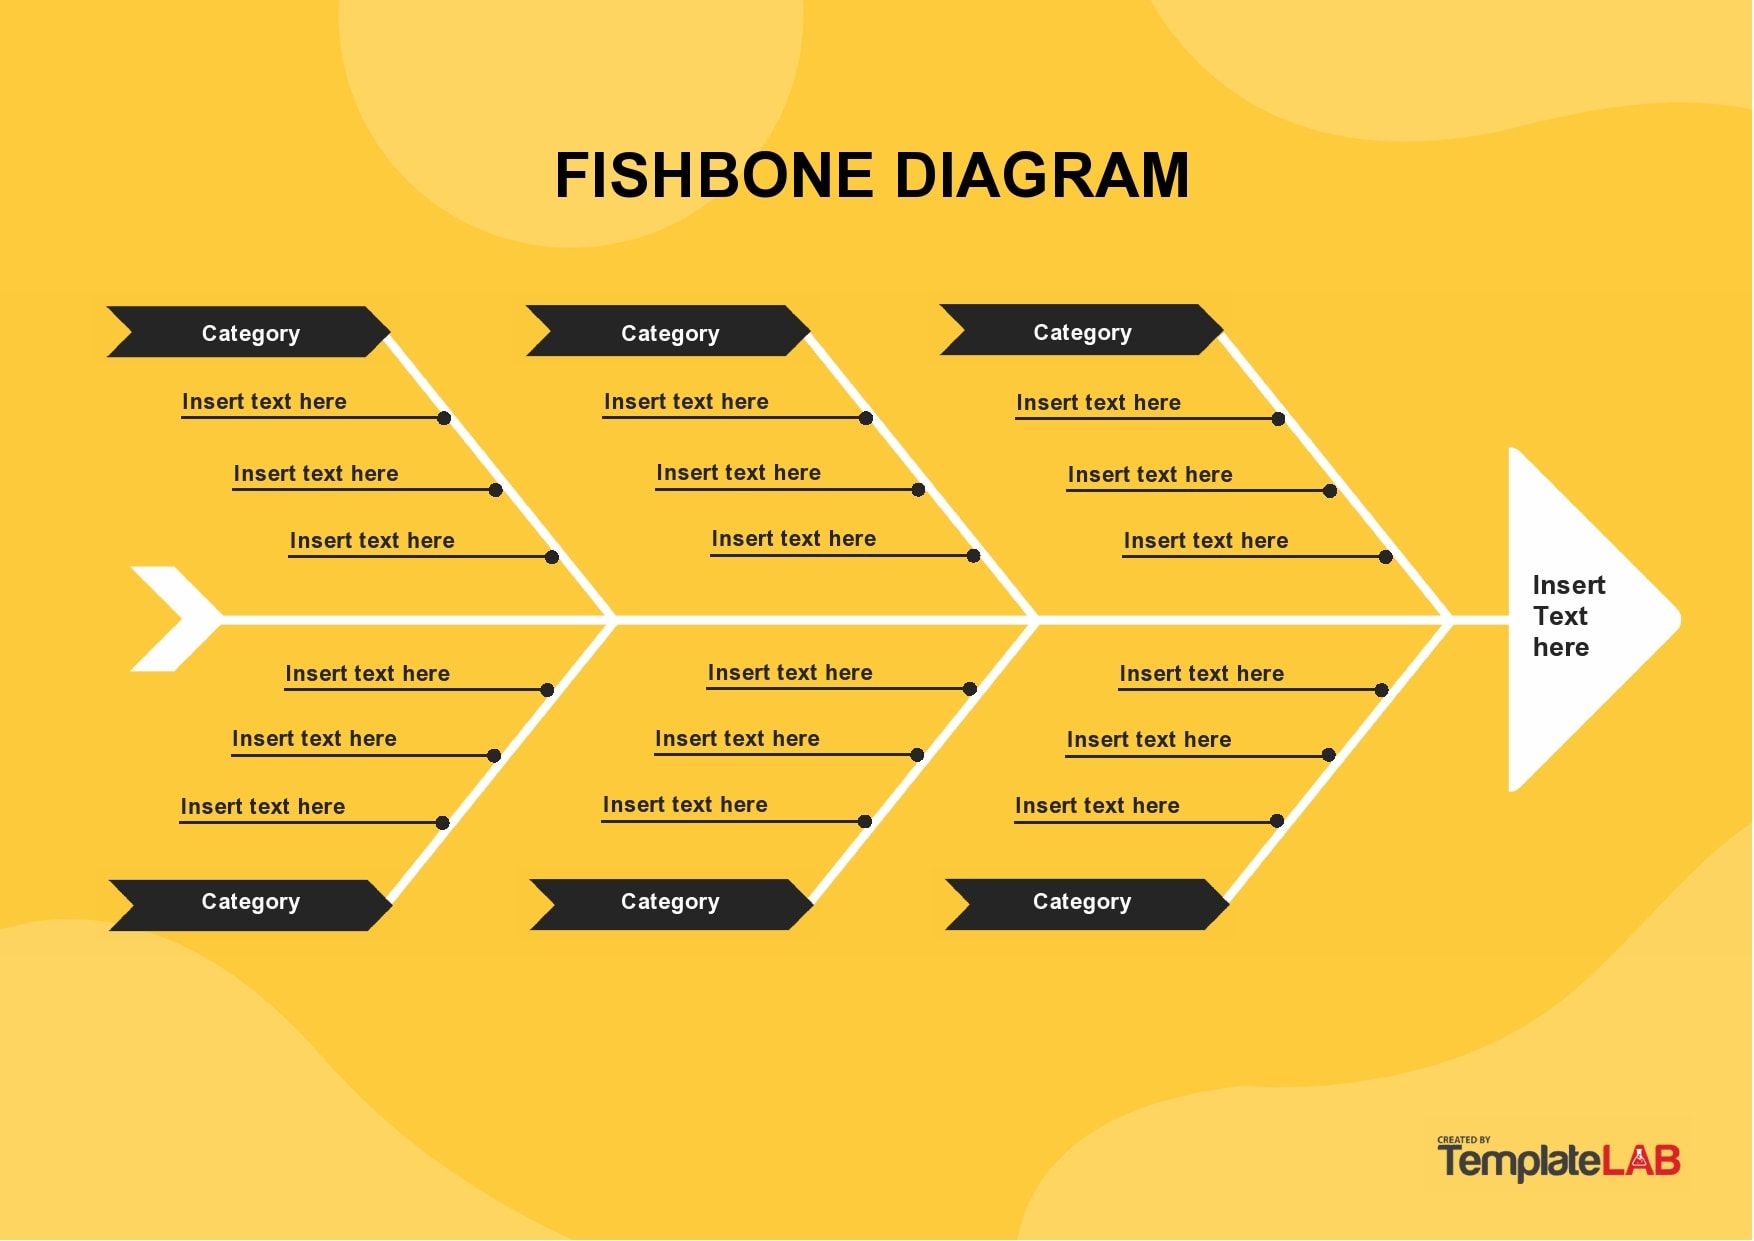
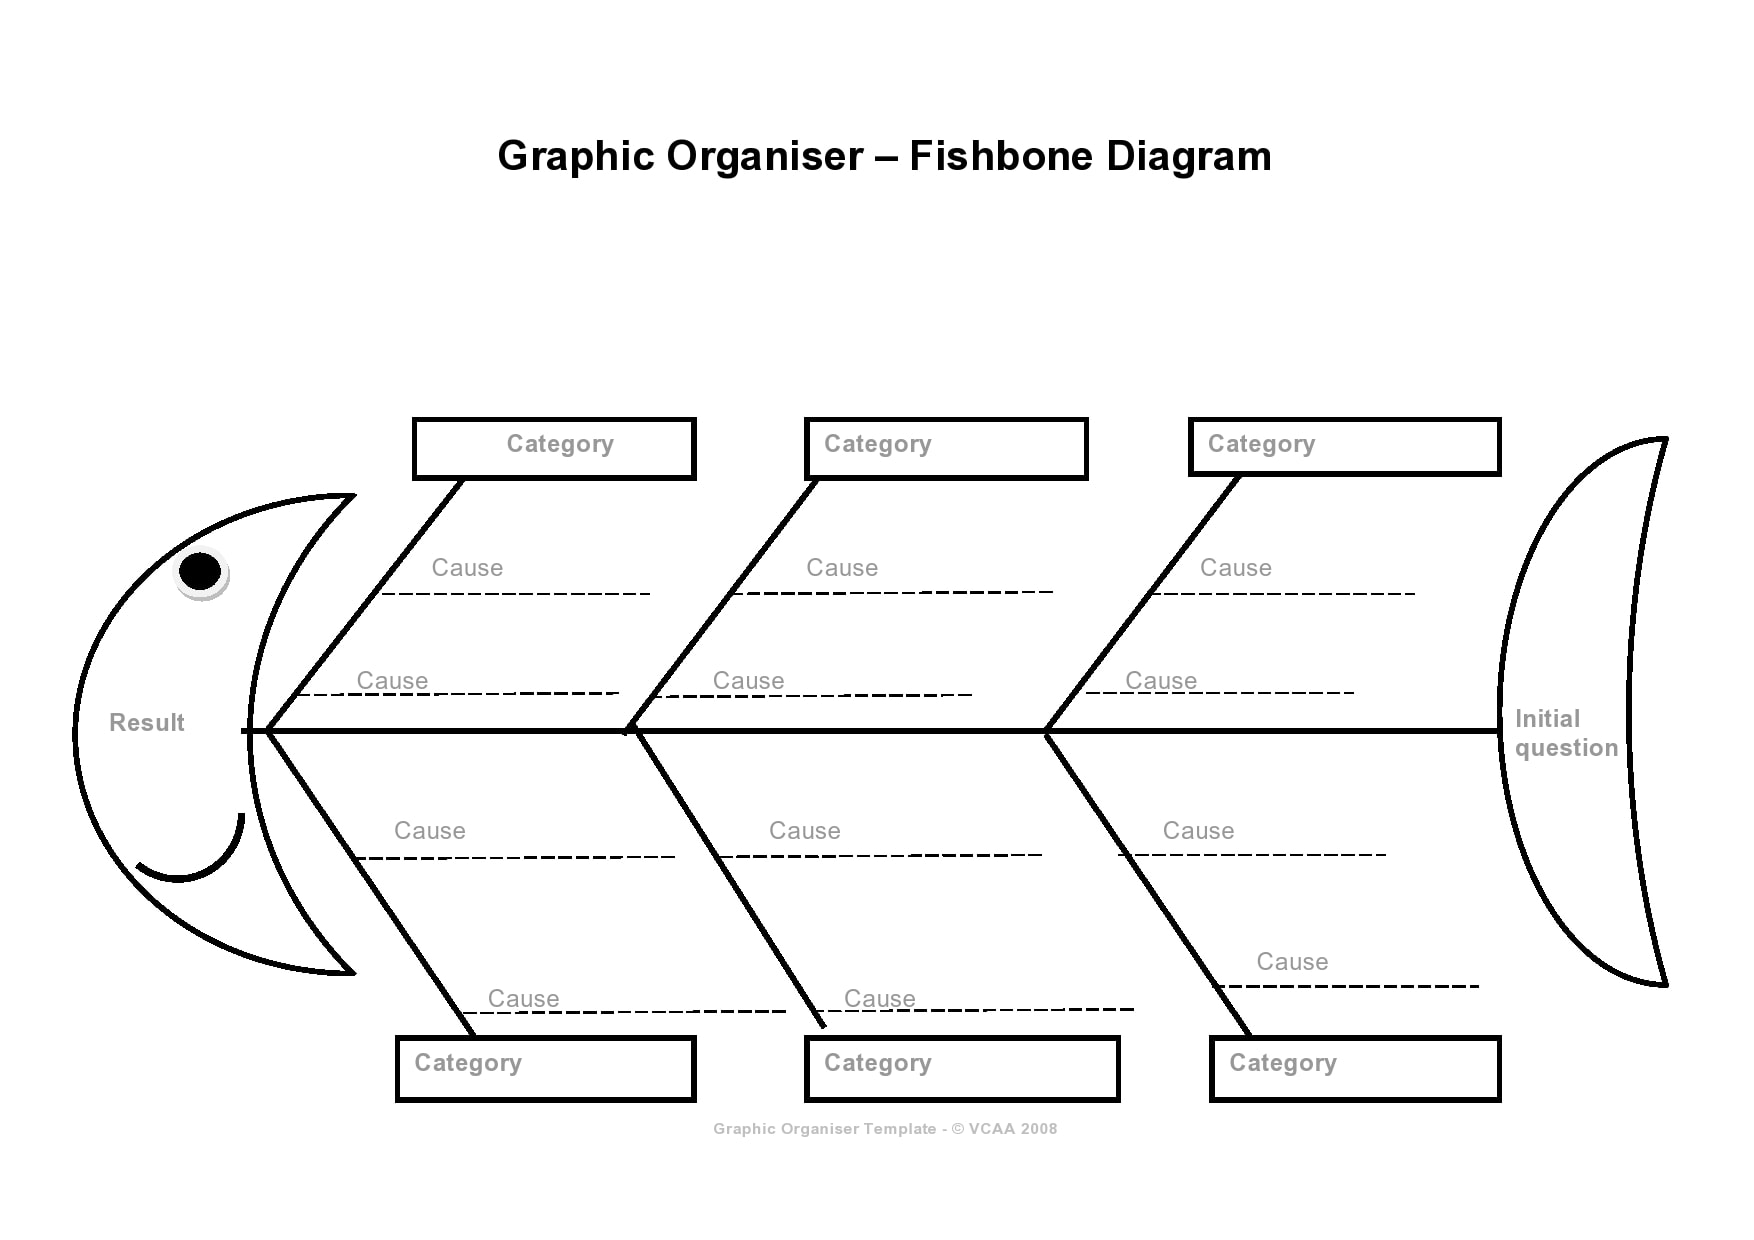
The fishbone template is a simple visualization of a problem’s causes and as the name implies, the diagram has the appearance of a fish skeleton, where each bone represents a category of a root cause.
The purpose of the fishbone diagram template is to discourage the common tendency of assigning just one root cause to issues that might have deeper causes. Here are some examples of this diagram:
- Operations Outage
Let’s assume that a production line breaks down for a few shifts because of a failed piece of equipment. By creating the diagram, you determine that the equipment has several design issues and that you didn’t detect these problems during maintenance.
Should you replace the piece of equipment, several issues might complicate the process and make the outage last longer. - Service Outage
Let’s assume that you have software experiencing an outage after a “bug” that you missed during the testing phase. The procedures needed to solve the problem don’t go smoothly as planned because back-out processes failed and your developers can’t access environments because of security key issues. - Quality Failure
Let’s assume that a customer discovers an issue with a product that had already passed quality control. You conduct a quality control investigation and the results revealed that a machine error has caused the problem and quality control processes failed to detect the issue. - Security Incident
Let’s assume that one of your workers loses their laptop filled with sensitive company data. The investigative team discovers that you don’t have a policy or procedure that could have prevented such an issue.
Through your diagram, you also discover technical shortcomings like a poor password policy, insufficient encryption, and a non-existent data audit trail.
Cause And Effect Diagram Templates


How do you make a fishbone diagram?
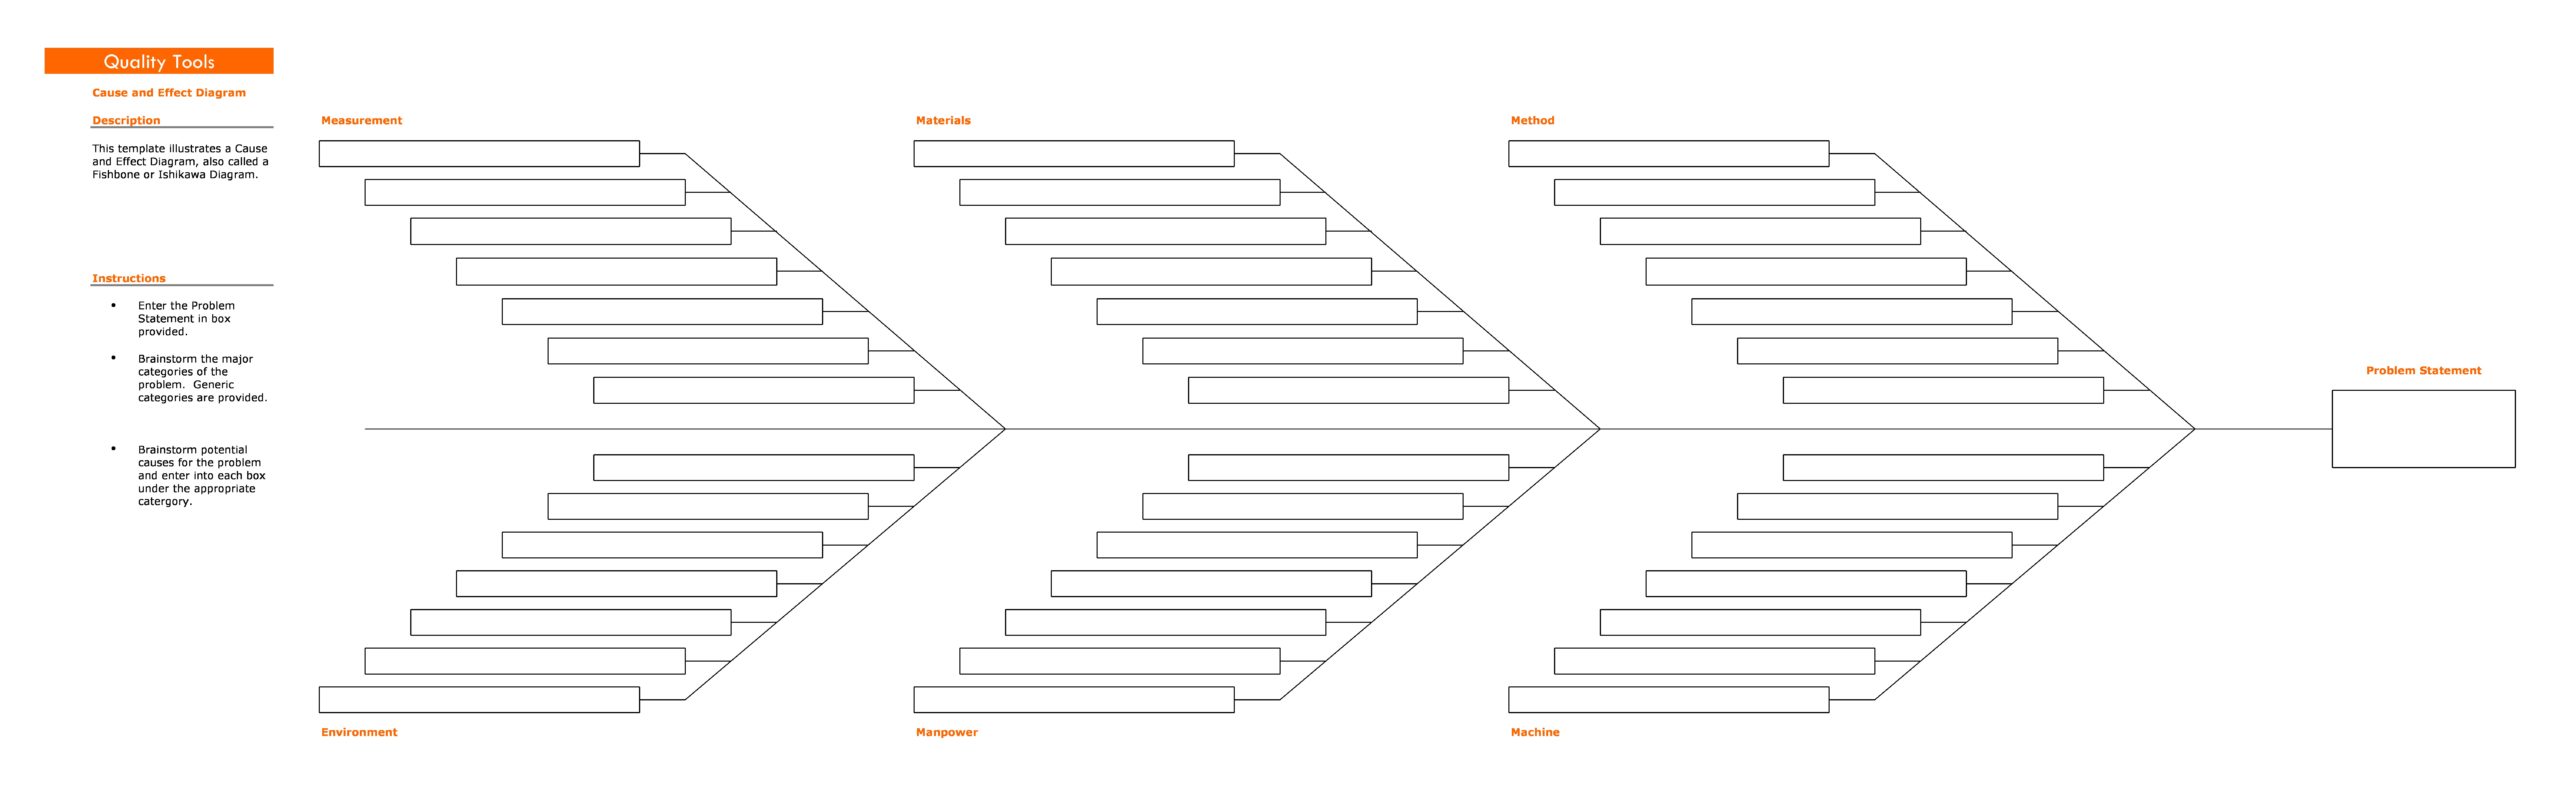
You use a fishbone diagram template to visualize all of the probable causes of an issue, identify underlying causes, and anticipate the probable consequences. Following are the steps you can use as a guide in the making a fishbone or cause and effect diagram template:
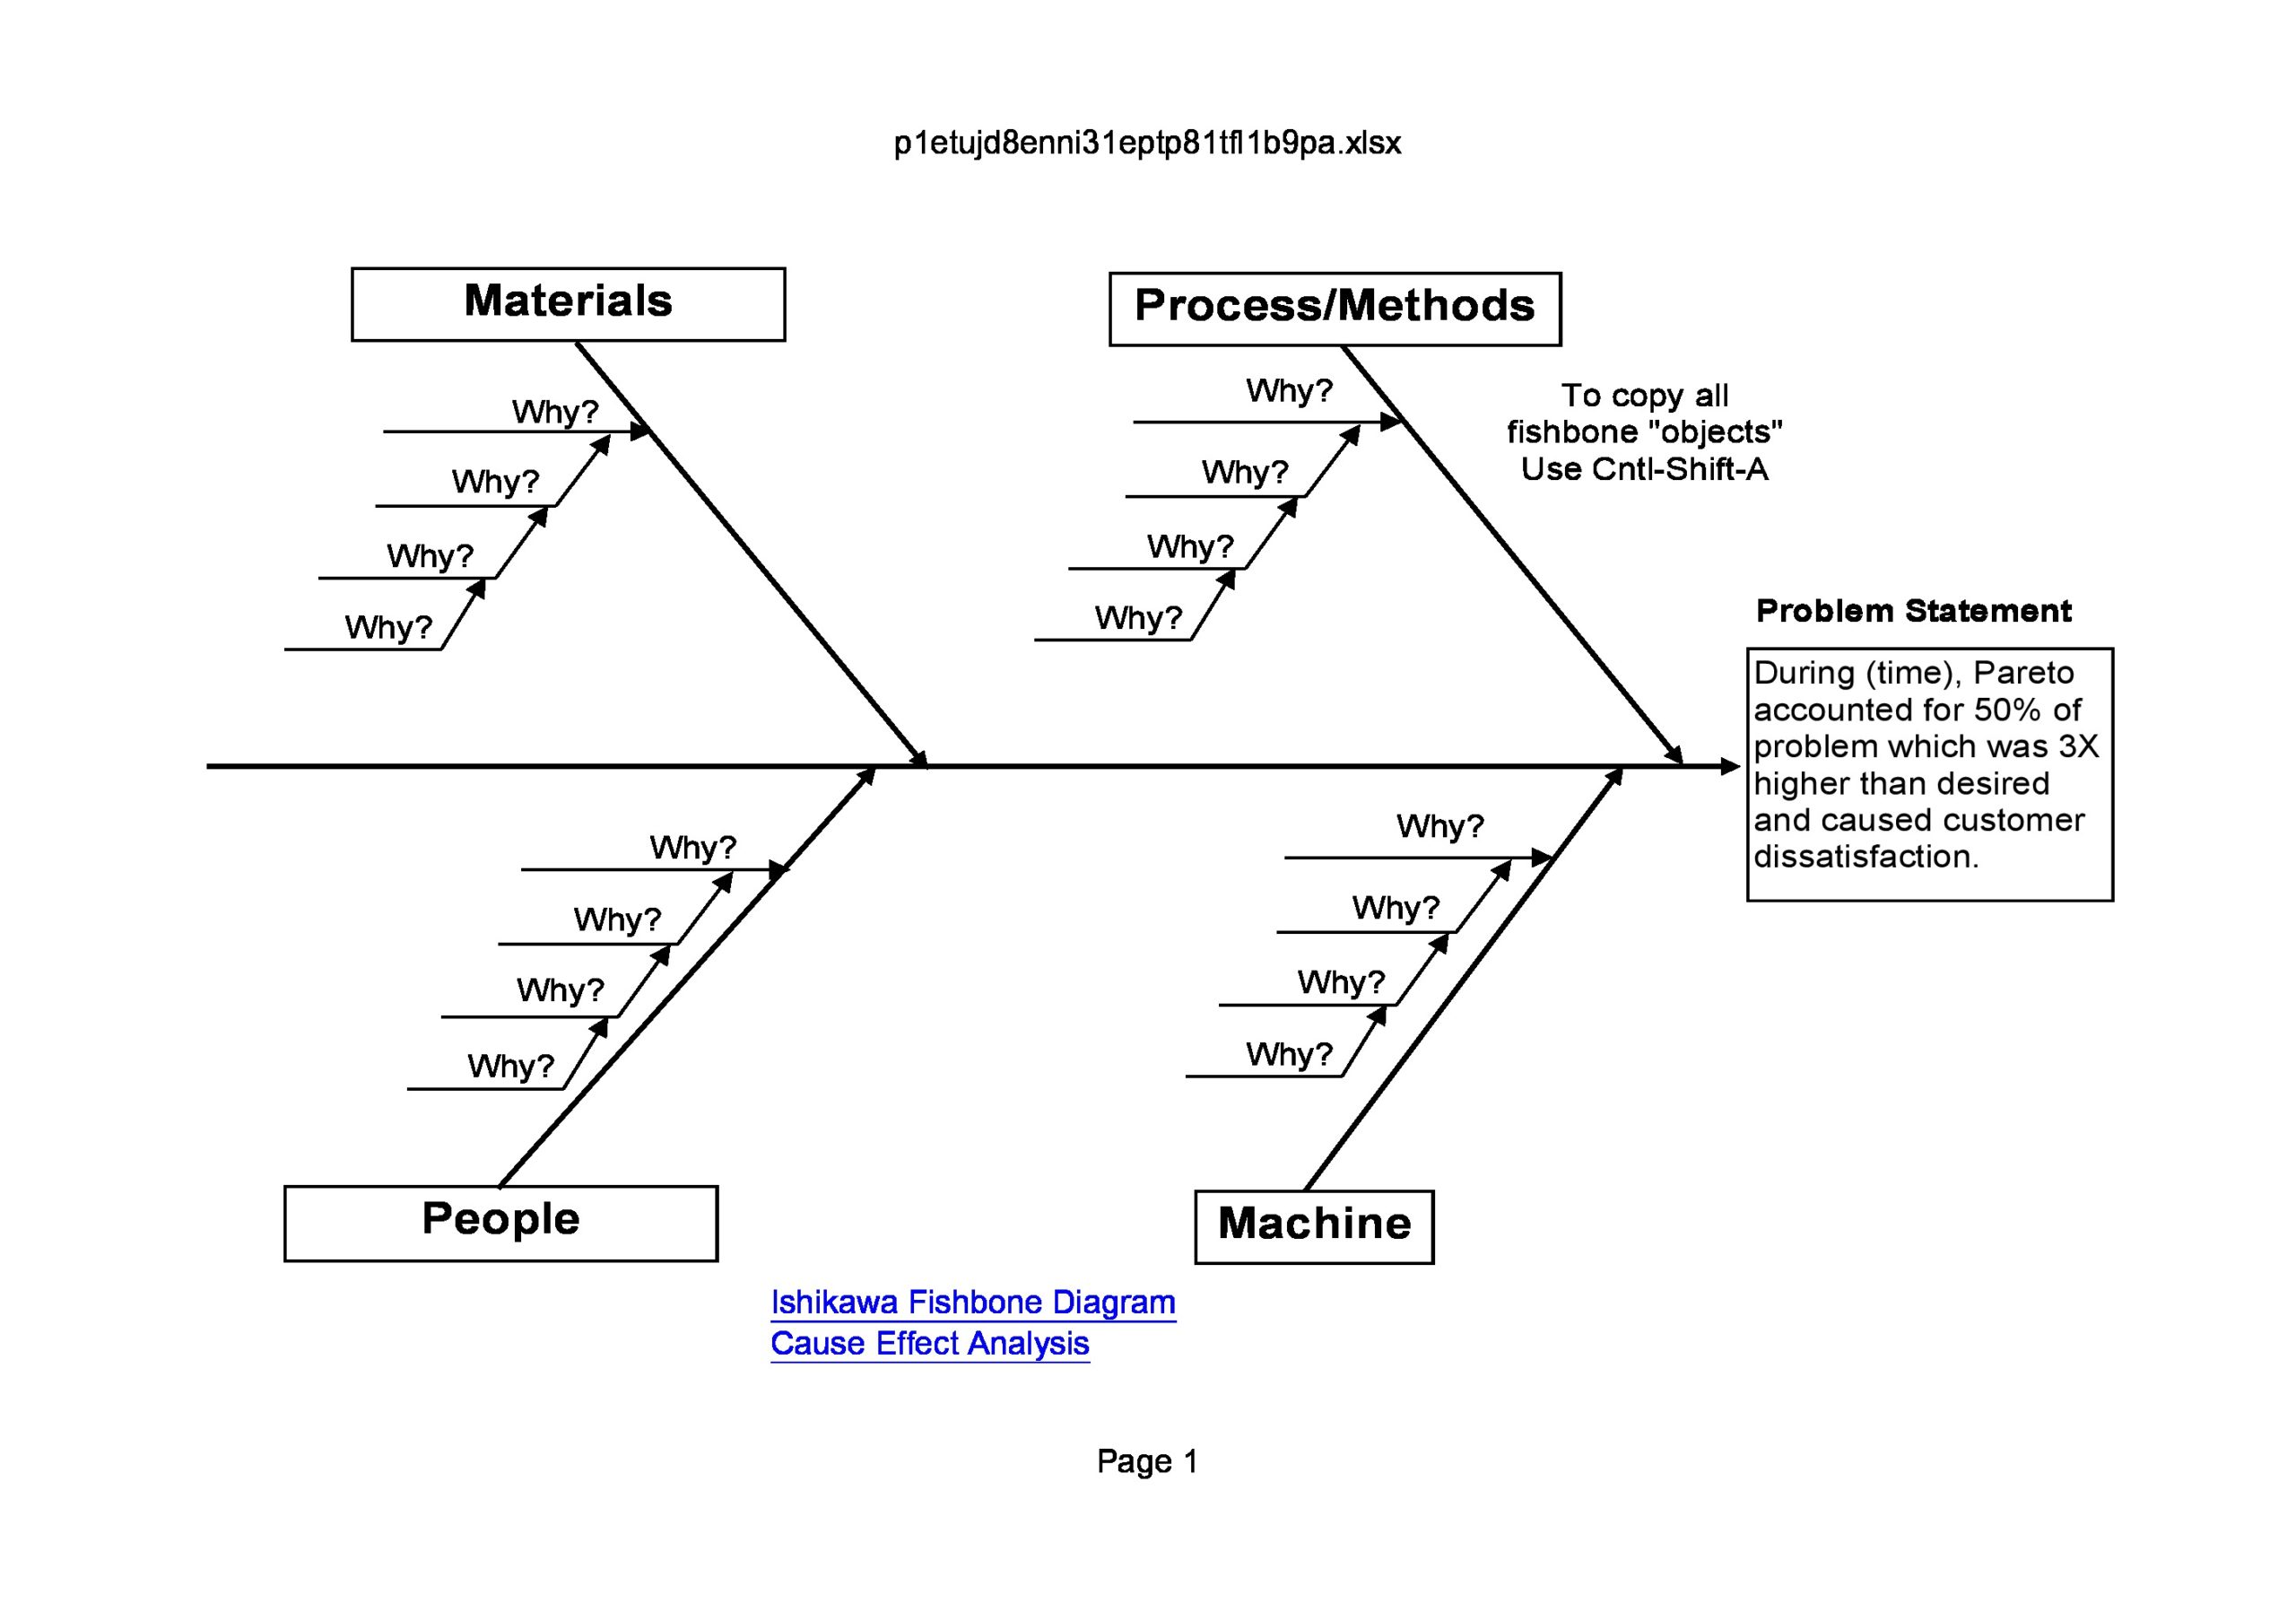
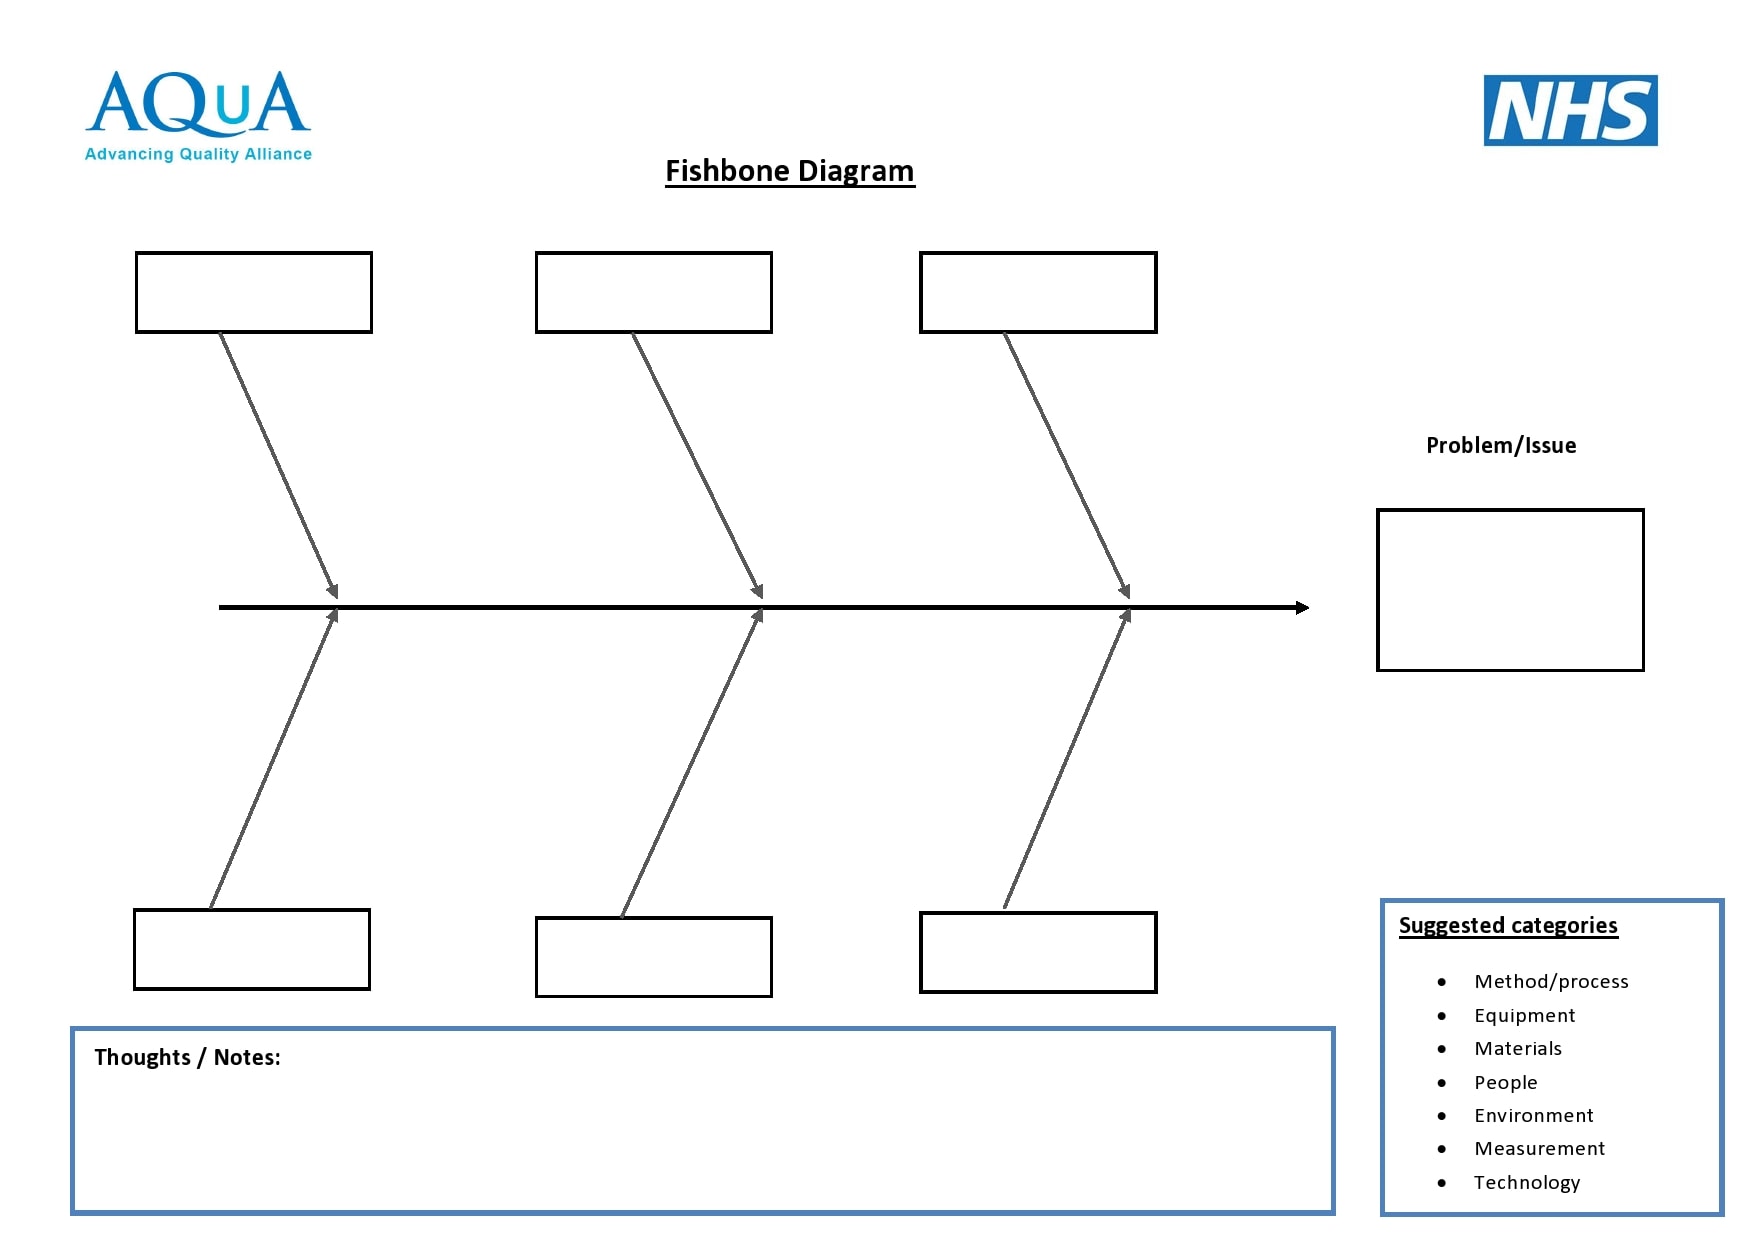
- Define your problem statement
Come up with a statement that precisely explains the problem, how, and when it occurred. Add this to the right side of the diagram as the “head” of the fish. Brainstorm with your colleagues to make sure everyone agrees with how you defined the problem before you explore the causes. - Identify cause categories
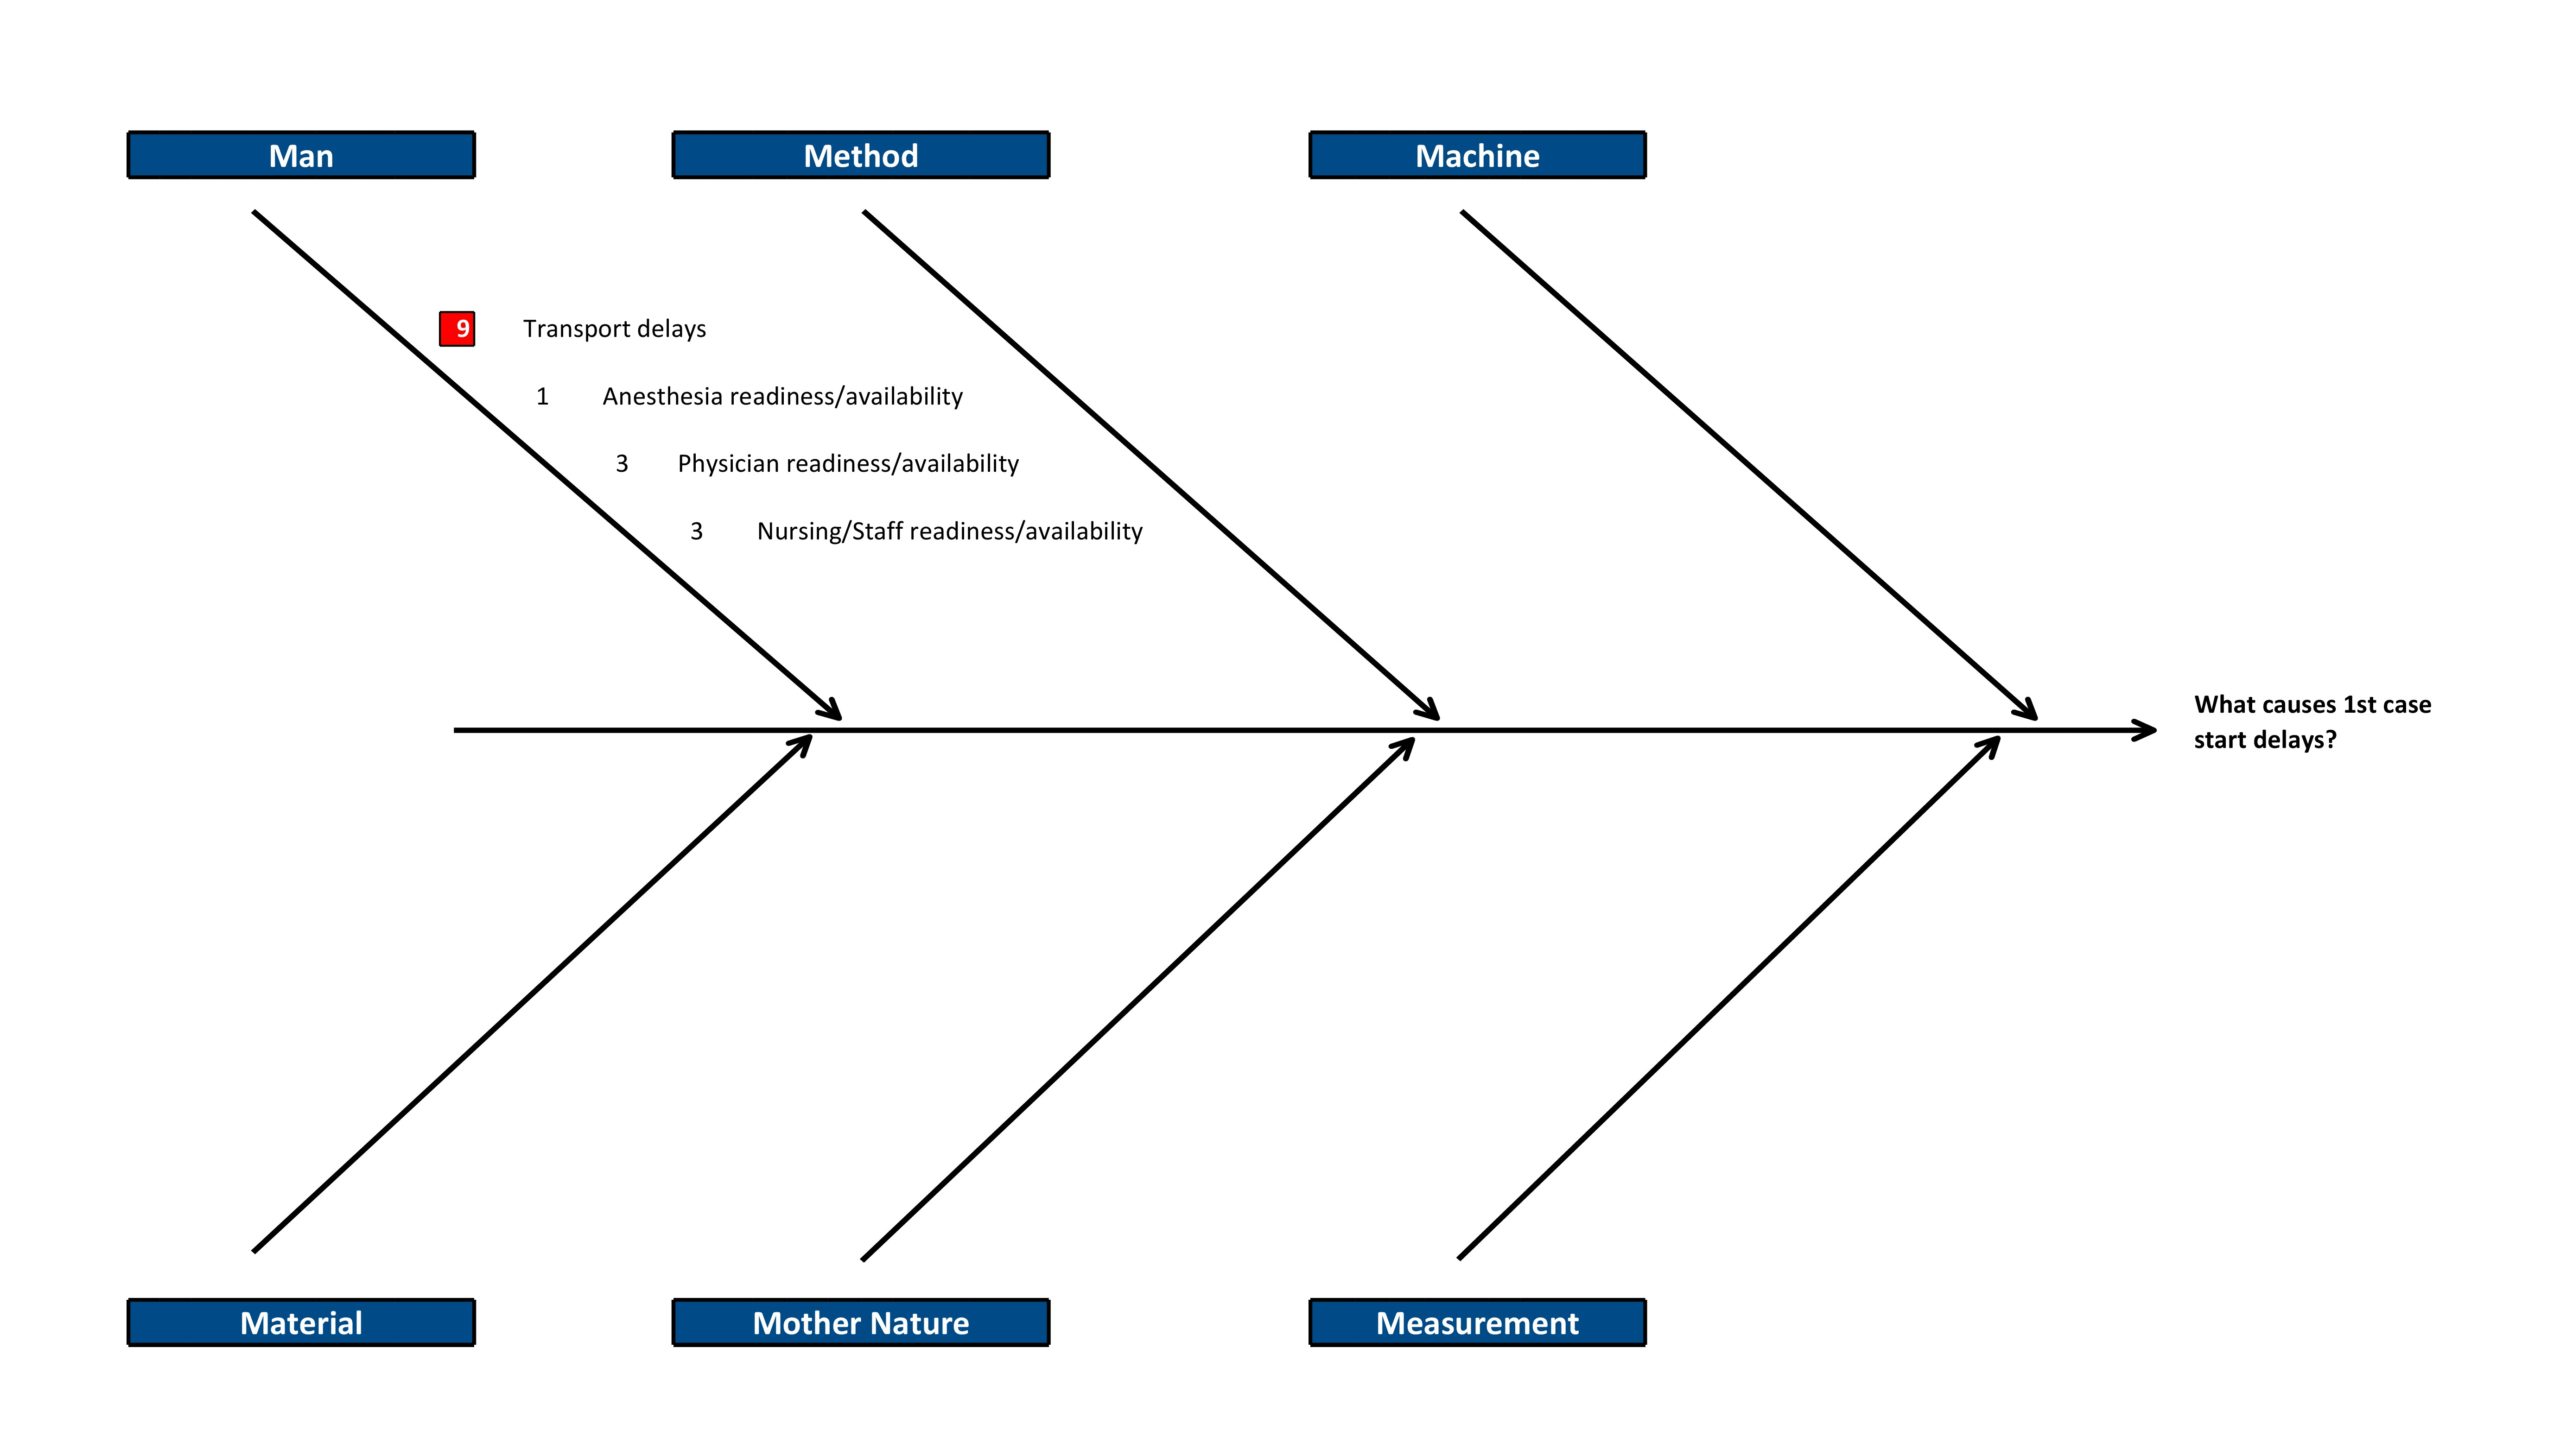
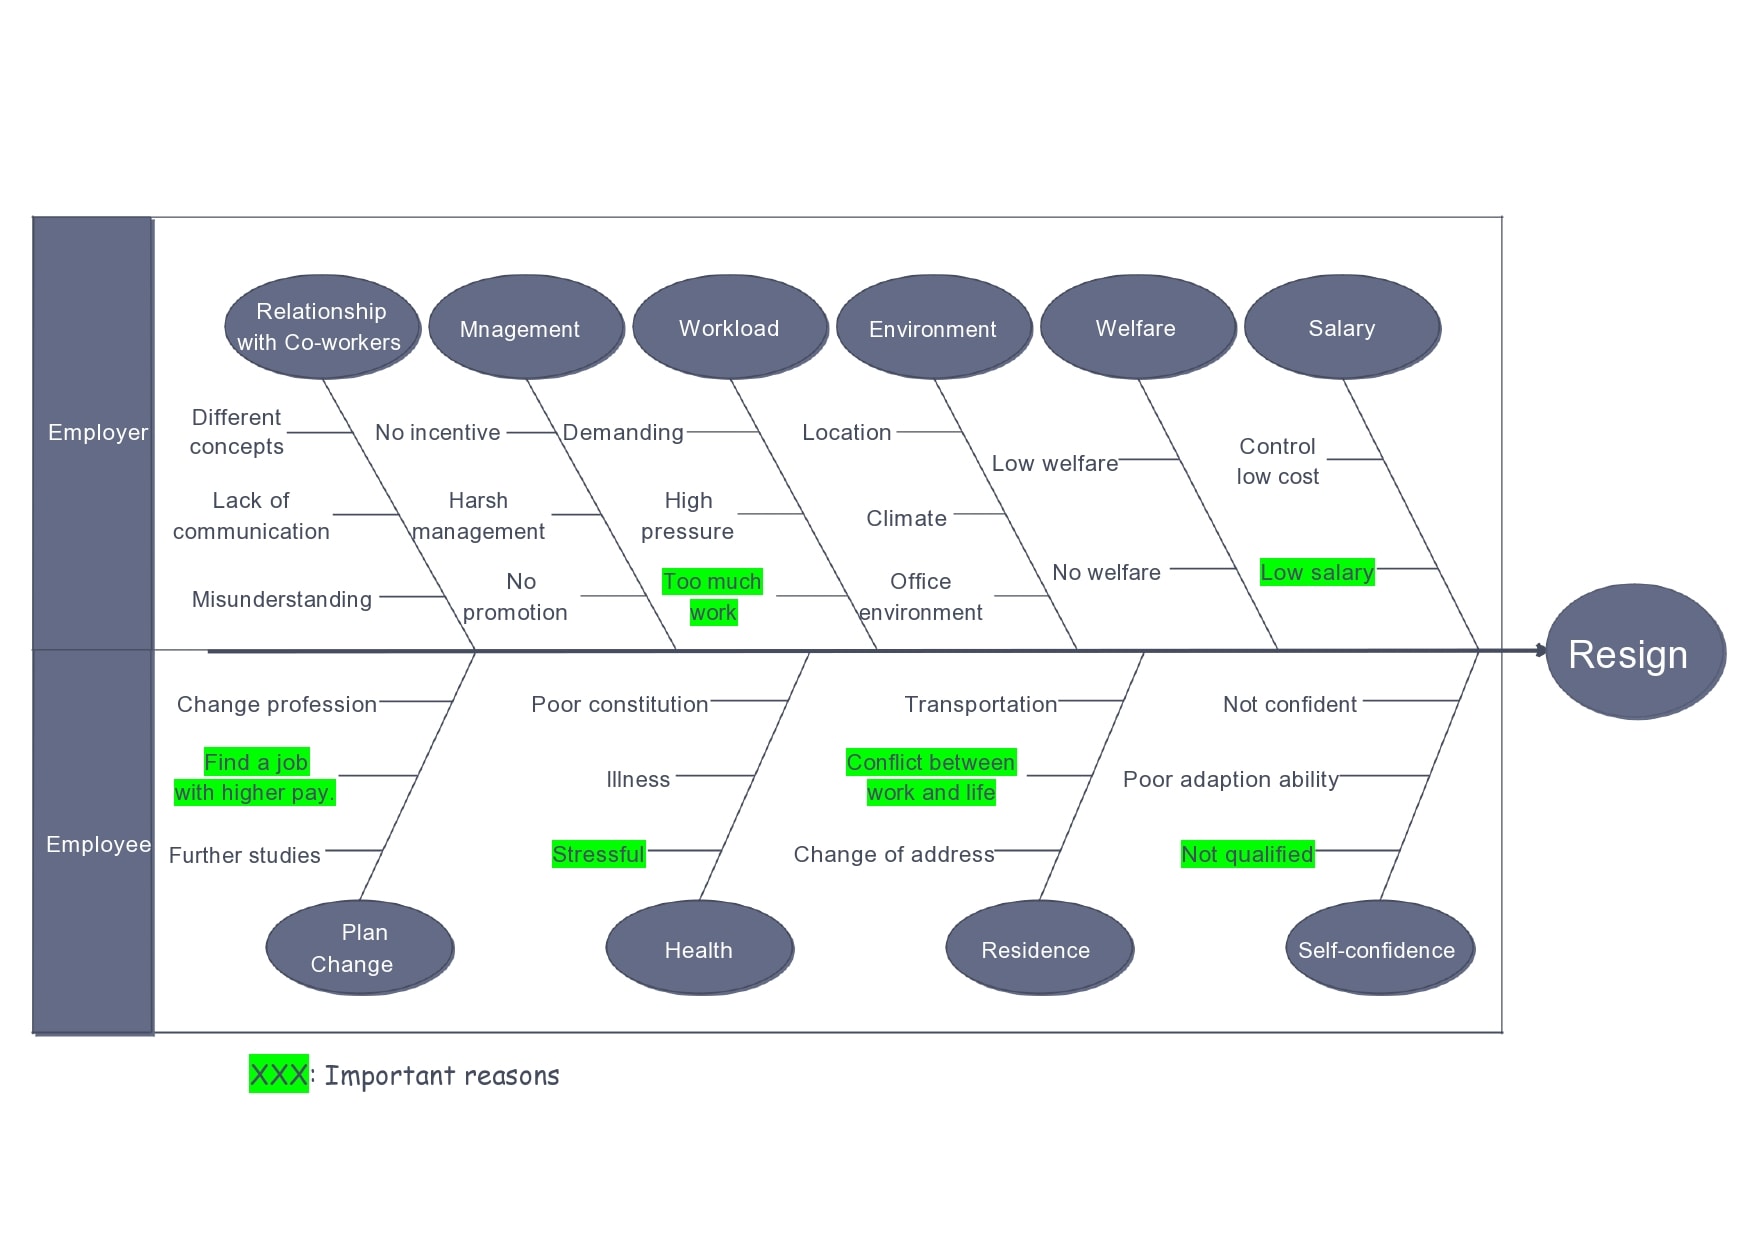
Next, pinpoint the broad areas or categories where the potential causes of your cause and effect chart fall into. For instance, if you’re trying to assess a problem with a software product, you may also want to take a look at the users or marketing.
If you’re dealing with a physical product, you may consider including methods, materials, the environment or even people. As much as possible, try to limit the number of categories to 10 and below. - Make a list of the causes
As soon as you have listed all of the categories, it is time to list all of the possible causes. These represent the “bones” of the fish which you will use as the basis for determining the problem’s root cause. Some groups use this diagram along with the “5 Whys” to systematically uncover new probable causes.

")
")